












Why are some investors always lucky to make money wherever they invest? There must be a guardian angel who always follows and helps them, have you ever thought like that? Yes, actually this angel is the Double Top and Bottom Patterns toolkit. Let’s own a lucky angel in trading right away!
What is Double Top and Bottom Patterns?
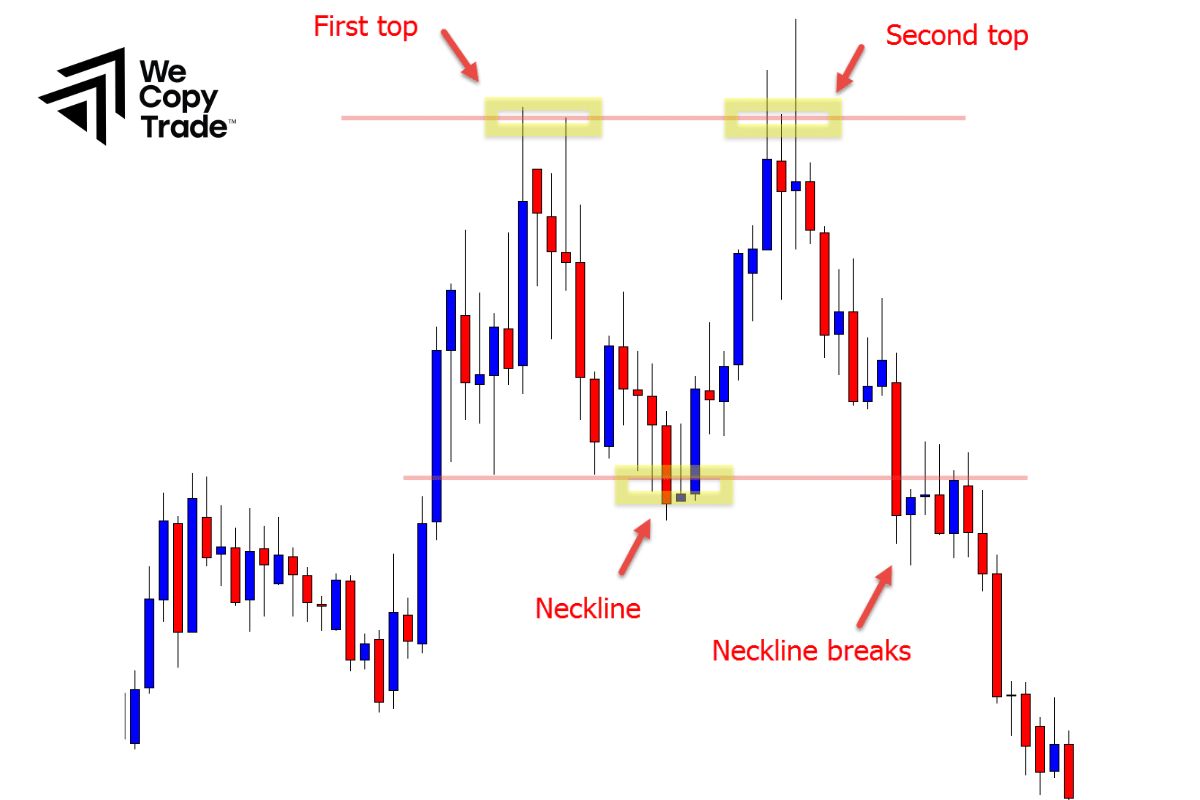
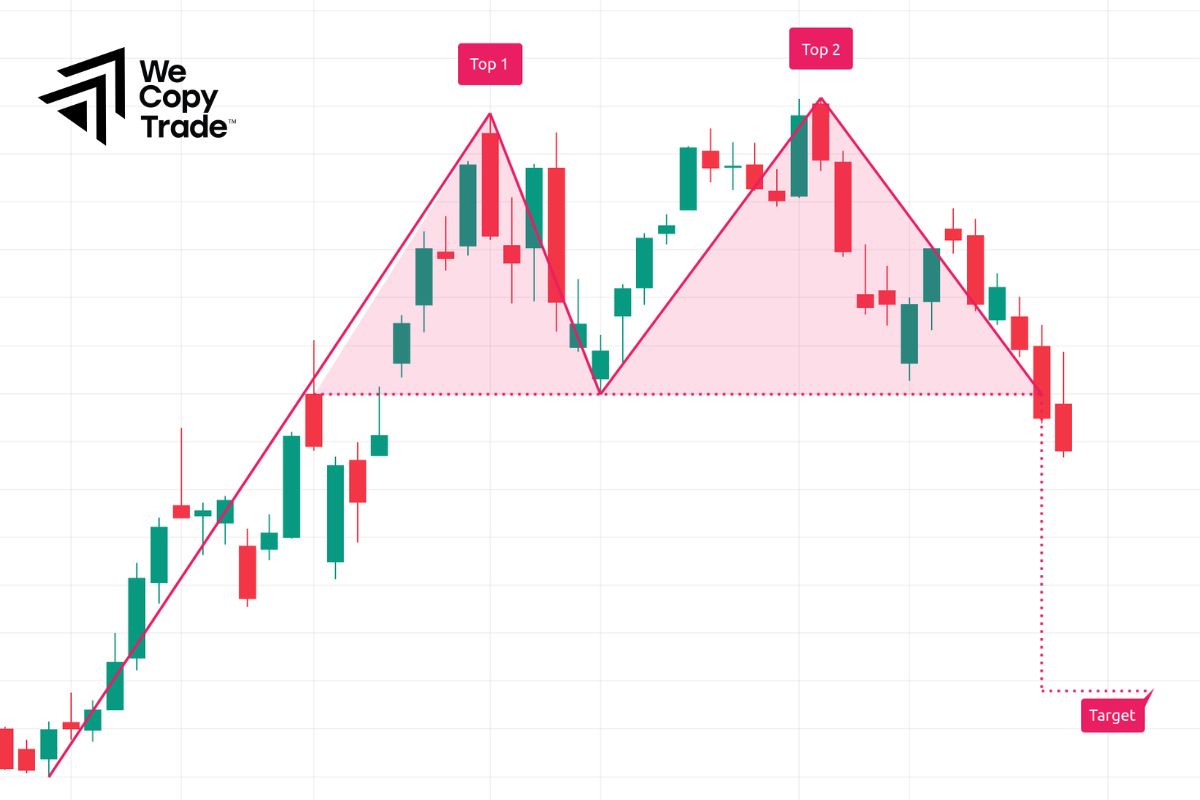
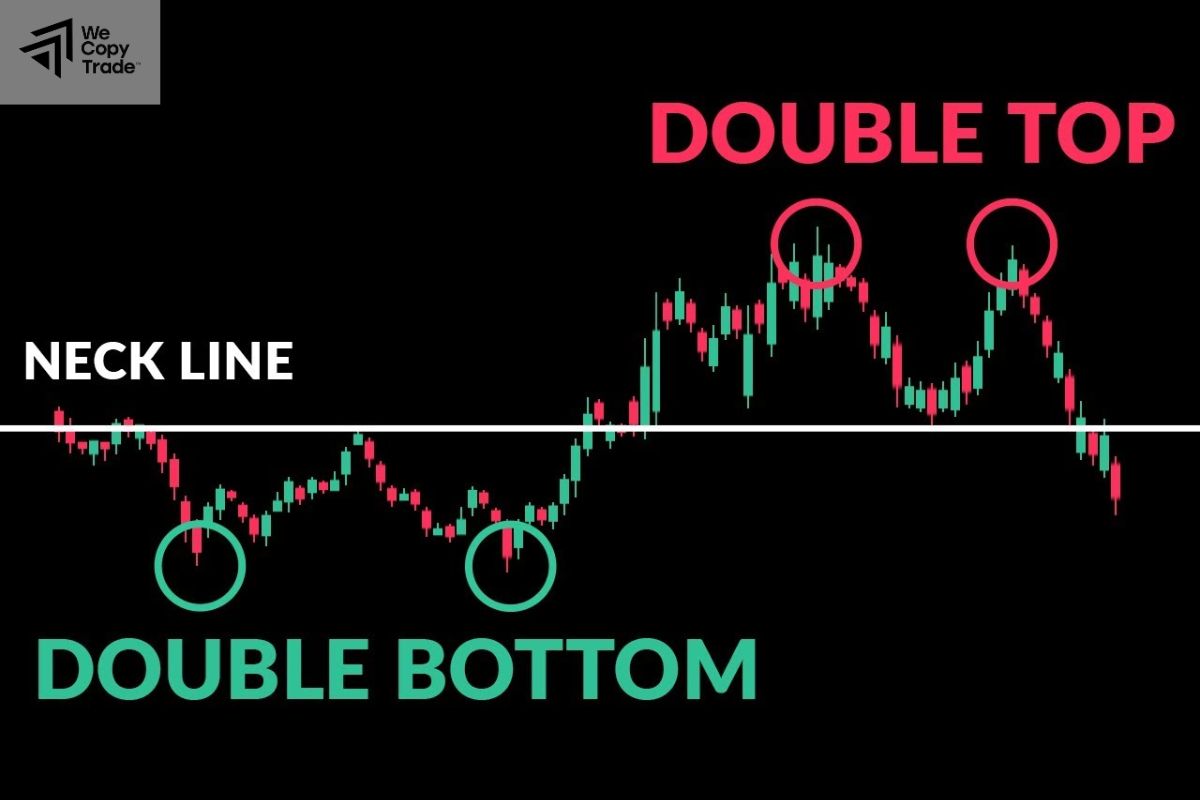
Double Top and Bottom Patterns represent a weakening uptrend or downtrend and often signal an impending reversal. Just like a ball bounces less strongly the second time than the first time. The top or bottom is the highest or lowest point that the price reaches in a given period of time. The neck is the middle part of the pattern, located between the two tops or bottoms.
In addition, trading volume helps confirm the reliability of the pattern. When the price makes a second top or bottom, trading volume usually decreases compared to the first time, indicating that the strength of the trend is weakening.
See more:
- Top Common Types Of Chart Patterns Trading For Beginners
- Best Popular Types of Reversal Patterns Candlestick
- Symmetrical Triangle Patterns in Trading You Should Know
Advantages and disadvantages of Patterns
By recognizing and taking advantage of the signals from Double Top and Double Bottom patterns, investors can make timely buying and selling decisions
Advantages of Patterns
- Quickly solves recurring problems with pre-defined structures.
- Can be applied across different projects, saving time.
- Promotes uniform approaches, improving maintainability.
- Simplifies communication by offering a shared framework.
- Guides effective, best-practice solutions.
- Often designed with growth in mind.
Disadvantages of Patterns
- May lead to forced, suboptimal solutions.
- Can introduce unnecessary complications.
- Some patterns are hard to master.
- Limits creativity by sticking to predefined structures.
- May not work well in all situations.
- Can make long-term upkeep difficult.
Identifying Double Tops and Bottoms
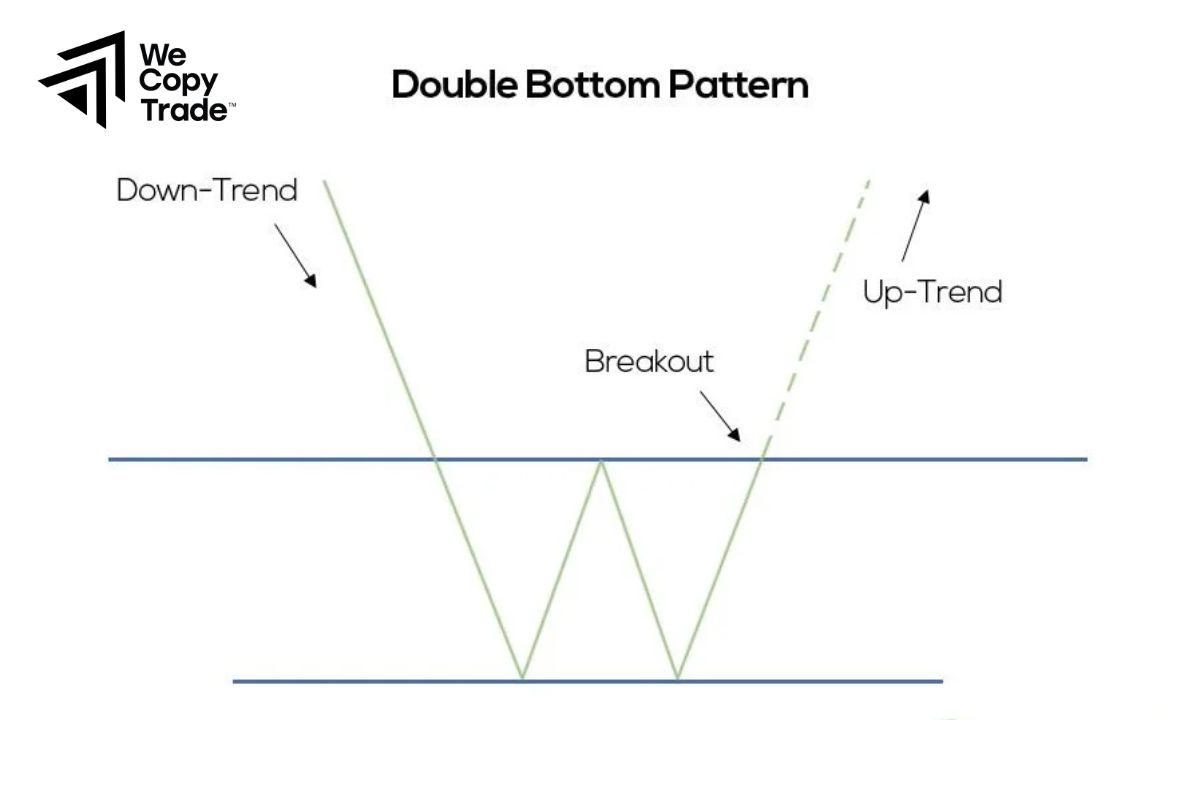
Double Top and Bottom Patterns, which form as the letters ‘M’ and ‘W’ on the chart, are important signals that signal a market reversal. When the price touches two close peaks or two lows, and then breaks the neckline with high volume, that is when the trend may change. Think of the neckline as a barrier, when the barrier is broken, the price will move in a new direction. To confirm the pattern, look closely at:
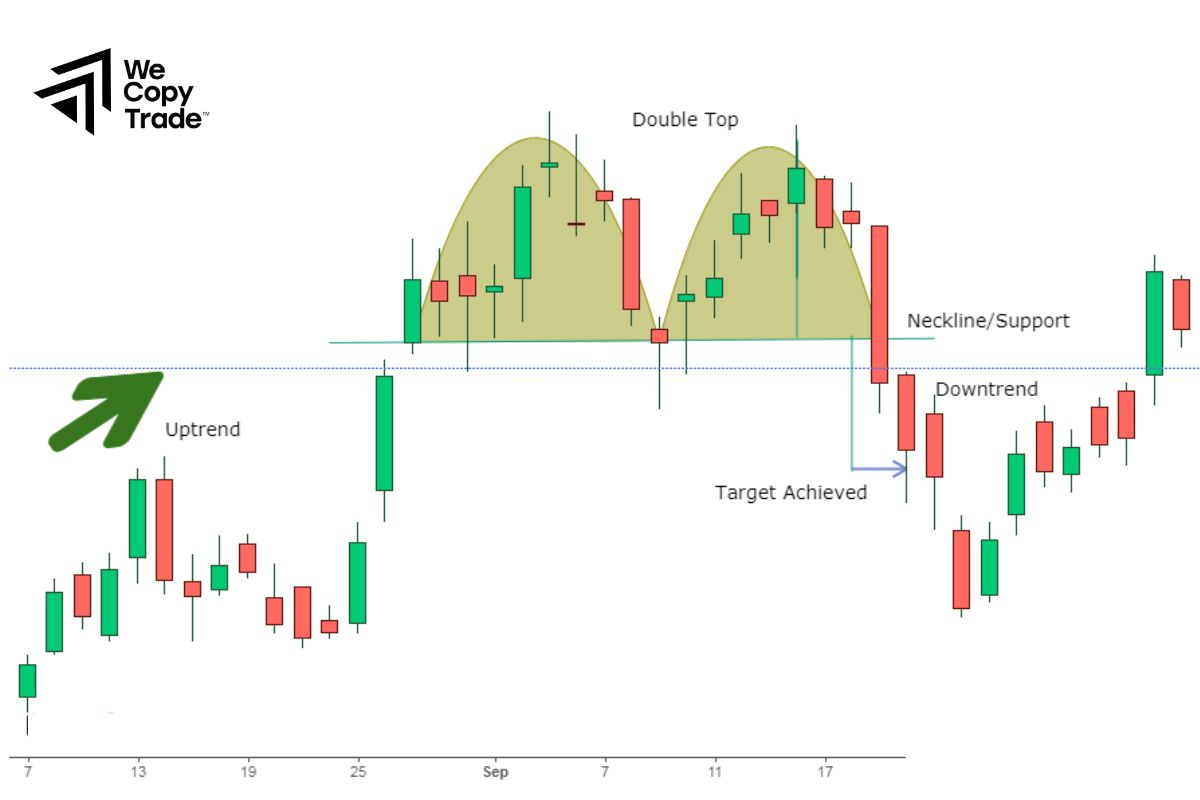
- For double tops: The price fails to break above the first peak, indicating that the strength of the uptrend is weakening. When the price breaks below the support line, a bearish reversal signal is confirmed.
- For double bottoms: The price fails to break above the first bottom, indicating that the strength of the downtrend is weakening. When the price breaks the neckline, the bullish reversal signal is confirmed.
Breaking the neckline with high volume shows that there is a strong force pushing the trend change. Just like a dam breaks, when water overflows, the flow will change completely. Similarly, when the price breaks the neckline, the trend will also change.
To become a successful trader, understanding and applying the Double Top and Bottom Patterns is very important. However, theory is only a part, you need to practice regularly on the chart to get familiar with these patterns. Start by looking for these patterns in the trading history of the stocks you are interested in.
Trading the double tops and bottoms chart patterns effectively
Double Top and Bottom Patterns are useful tools for traders to predict market changes. Think of them as “sails” that signal which direction the price ship will go. Let’s learn how the kite works to steer the ship in the right direction through the following simple ways:
Entry points:
- Double bottom: Buy when the price breaks above the top of the pattern.
- Double top: Sell short when the price breaks below the bottom of the pattern.
Confirm with indicators:
- RSI: When the RSI diverges from the price, it further confirms the reversal signal.
- Bollinger bands: When the price breaks above the Bollinger bands, it indicates that the market is overbought or oversold, increasing the possibility of a reversal.
For example, suppose a stock price has fallen sharply and formed two consecutive bottoms. When the price breaks above the top of the pattern and the RSI also gives a buy signal, you can place a buy order to join the new uptrend. Conversely, if a stock price has risen sharply and formed two consecutive tops, when the price breaks below the bottom of the pattern and the RSI gives a sell signal, you can place a short sell order to take advantage of the downtrend.
Conclusion
In conclusion,the Double Top and Bottom Patterns is an extremely effective technical analysis tool. However, we should understand how it works and combine it with many other indicators to get the most accurate results!
See now:





