













Bollinger Bands are a popular technical analysis tool used by traders to gauge market volatility and price trends. When the market is volatile, these bands expand and during periods of low volatility, they contract. Therefore, to better understand how the band formulas work in the market, follow along now!
What are Bollinger Bands?
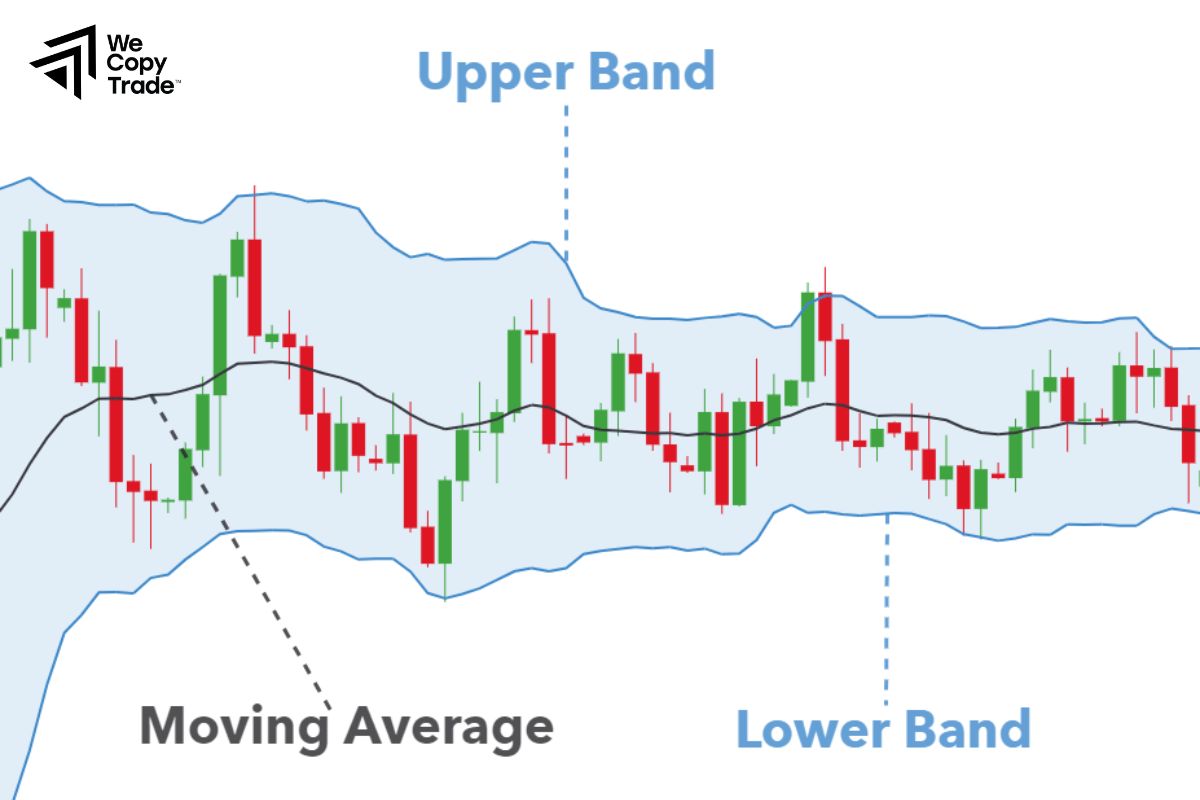
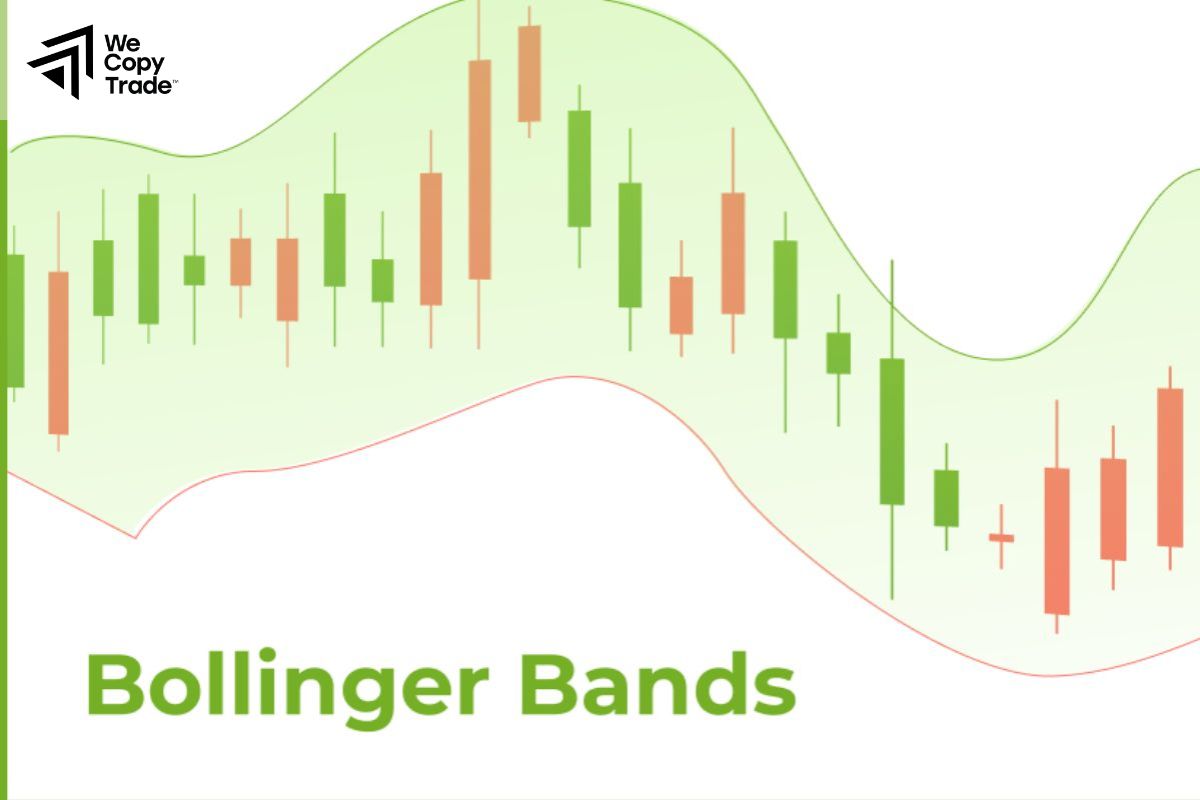
Bollinger Bands are a technical analysis tool used in trading to measure market volatility and identify potential price trends. Created by John Bollinger, they consist of three lines:
- Middle Band: A simple moving average (usually 20 periods).
- Upper Band: The middle band plus two standard deviations.
- Lower Band: The middle band minus two standard deviations.
See more:
- What is a stock broker? How to choose the best forex broker?
- The 5 Best Momentum Indicators to Analyze Trend Strength
- Top 7 Best Volatility Indicators in the Market Updated 2024
How to use Bollinger Bands effectively
To use Bollinger Bands effectively in trading, follow these key strategies:
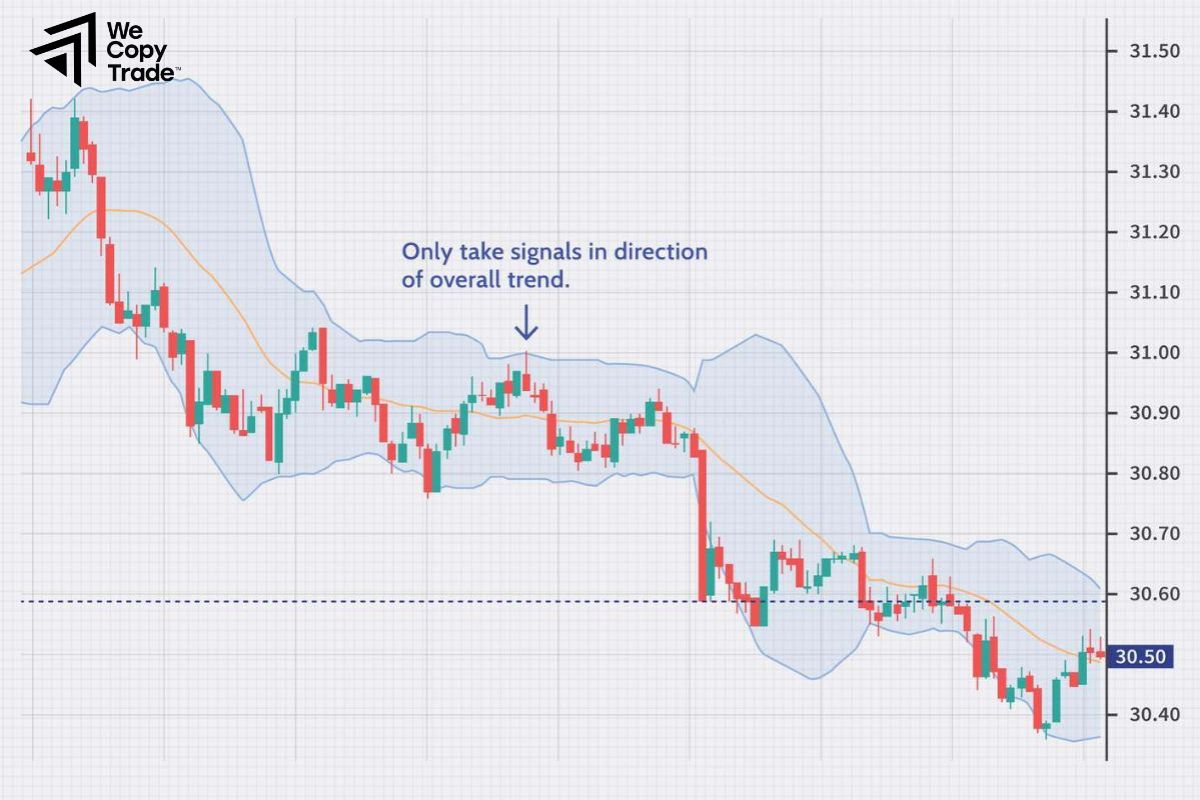
- Identify Overbought and Oversold Conditions: When the price approaches or touches the upper band, it may indicate an overbought condition, suggesting a potential sell opportunity. Conversely, if the price nears or touches the lower band, the asset might be oversold, signaling a potential buy opportunity.
- Use with Price Action: Bollinger Bands work best when combined with other indicators or price action analysis. For example, waiting for confirmation from candlestick patterns, support, or resistance levels can help improve the accuracy of signals.
- Look for Squeeze Signals: A “Bollinger Squeeze” occurs when the bands contract due to low volatility. This often signals that a breakout, either upward or downward, may occur soon. Traders monitor the squeeze for potential entry points when the market volatility increases.
- Monitor Trend Direction: In an uptrend, prices tend to stay near or above the middle band, while in a downtrend, they remain near or below the middle band. Using in combination with trend analysis helps traders stay on the right side of the market.
- Use with Relative Strength Index (RSI): Combining with the RSI can provide more reliable signals. For instance, if the price touches the lower band and the RSI indicates oversold conditions, it can be a strong buy signal.
How to calculate Bollinger Bands?
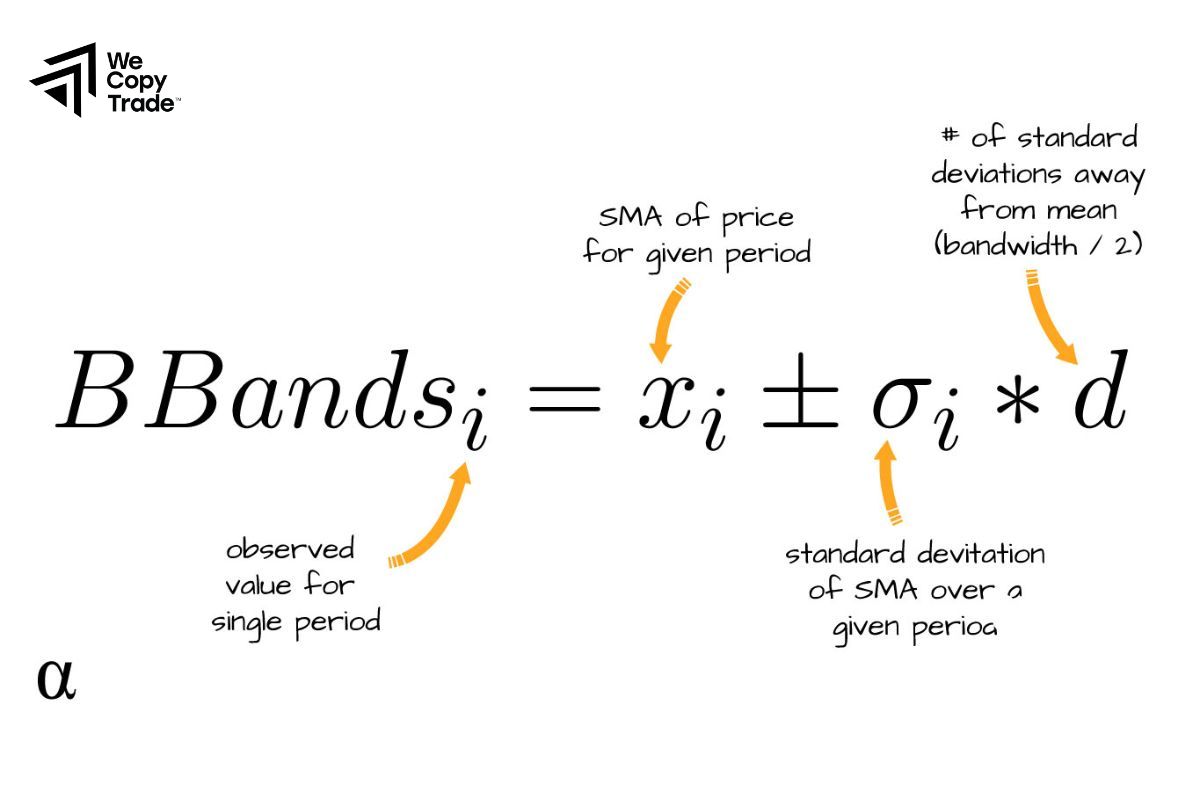
Bollinger Bands are calculated using three key components: a simple moving average (SMA), an upper band, and a lower band. The steps to calculate Bollinger Bands are as follows:
Calculate the Simple Moving Average (SMA)
- Choose a time period (commonly 20 days).
- Add the closing prices for the chosen period and divide the sum by the number of days in that period to get the SMA.
SMA=∑Pn/n
Where Pn is the closing price and n is the number of periods.
Calculate the Standard Deviation
- Find the squared difference between each closing price and the SMA.
- Take the average of these squared differences, and then take the square root of this average.
σ=∑(Pn−SMA)2/n
Calculate the Upper and Lower Bands
- The upper band is the SMA plus two times the standard deviation.
Upper Band=SMA+(2×σ)
- The lower band is the SMA minus two times the standard deviation.
Lower Band=SMA−(2×σ)
Once these calculations are done, you’ll have the middle band (SMA), the upper band (SMA + 2σ), and the lower band (SMA – 2σ)
Comparing Bollinger Bands vs Moving Average
Bollinger Bands and the Moving Average (MA) are both widely used tools in technical analysis, but they serve different purposes and offer unique insights. Here’s a comparison:
| Criteria | Bollinger Bands | Moving Average (MA) |
| Structure | 3 lines: Middle line (SMA), upper band, lower band | 1 line: Simple moving average (SMA/EMA) |
| Purpose | Measures volatility and identifies overbought/oversold conditions | Identifies average trend direction |
| Volatility | Clearly shows volatility (bands expand and contract) | Does not directly reflect volatility |
| Trend | Identifies trend and overbought/oversold levels | Identifies overall trend |
| Use | Find reversal points, breakouts based on volatility | Trend-following, support/resistance levels |
| Common Time Frame | 20 periods and 2 standard deviations | 20, 50, 200 periods |
Limitations when using Bollinger Bands in the market
While Bollinger Bands are a popular technical analysis tool, they have some limitations when used in the market:
- False Signals: Bollinger Bands can generate false breakouts or signals in low-volume markets or during periods of consolidation, leading to incorrect trade entries or exits.
- Not a Standalone Indicator: Bollinger Bands work best when combined with other technical indicators like RSI or MACD. Using them alone can lead to incomplete analysis and potential misinterpretation of market conditions.
- Lagging Nature: Bollinger rely on historical data (moving averages), so they tend to lag behind real-time price movements, making it difficult to predict sudden price changes.
- Limited in Trending Markets: In strong uptrend or downtrend, prices can hug the upper or lower bands for extended periods, leading traders to mistakenly believe the market is overbought or oversold when the trend might continue.
- No Directional Clarity: Bollinger Bands measure volatility but do not provide clear signals about the direction of the market (whether it will go up or down). Traders need additional analysis to determine the trend direction.
Conclusion
In conclusion, Bollinger Bands are a valuable tool for traders looking to analyze market volatility and identify potential price reversals. However, to use Bollinger effectively, it’s essential to combine them with other technical indicators and trend analysis to avoid false signals. When applied correctly, they can be a powerful addition to any trading strategy, helping to improve accuracy and timing in trades.
See now:





