













Momentum indicators play an essential role in trading, helping you assess the strength and speed of market trends. Understanding and effectively using these tools can improve your ability to predict trend changes and make more accurate trading decisions. Don’t miss the opportunity to improve your trading strategy and achieve better results.
What Are Momentum Indicators?
Momentum indicators are essential tools in technical analysis designed to measure the speed and strength of price movements in financial markets. By evaluating the rate at which prices are changing, these indicators provide traders and analysts with valuable insights into the underlying momentum driving market movements. This helps in identifying potential trends, reversals, or continuations in price behavior.
For instance, momentum indicators can reveal whether a current trend is gaining strength, weakening, or nearing a reversal point. Their primary function is to aid in understanding how vigorously a security’s price is moving, which is crucial for predicting future price action.
See more:
- What is a stock broker? How to choose the best forex broker?
- Top 7 Best Volatility Indicators in the Market Updated 2024
- What are Bollinger Bands? How to calculate Bollinger Bands?
What is the Strategy when Trading with Momentum Indicator?
When trading with momentum indicators, having a well-defined strategy is crucial for leveraging these tools effectively. Here’s a comprehensive approach to developing a strategy for trading with momentum indicators:

- Know Your Indicator: Understand how the momentum indicator functions and what signals it gives. Popular ones include RSI, MACD, ROC, and Stochastic Oscillator.
- Choose the Right Indicator: Pick indicators that fit your trading style whether you’re day trading, swing trading, or investing long-term. Use multiple indicators to confirm signals and improve accuracy. Decide when to buy or sell based on the indicator’s signals. For example, buy when RSI crosses above 30 or when MACD line crosses above the signal line.
- Monitor and Adjust: Regularly check how well your strategy is working and make adjustments as needed. Change your strategy based on market conditions.
Top 5 Best Momentum Indicators
Momentum indicators are essential tools in technical analysis for measuring the speed or rate of change in a stock’s price. Here are five of the best momentum widely used by traders:
Relative Strength Index (RSI)
- RSI measures the speed and change of price movements, oscillating between 0 and 100. It identifies overbought or oversold conditions.
- An RSI above 70 suggests overbought conditions, while an RSI below 30 indicates oversold conditions. Traders use these levels to anticipate potential reversals.
Moving Average Convergence Divergence (MACD)
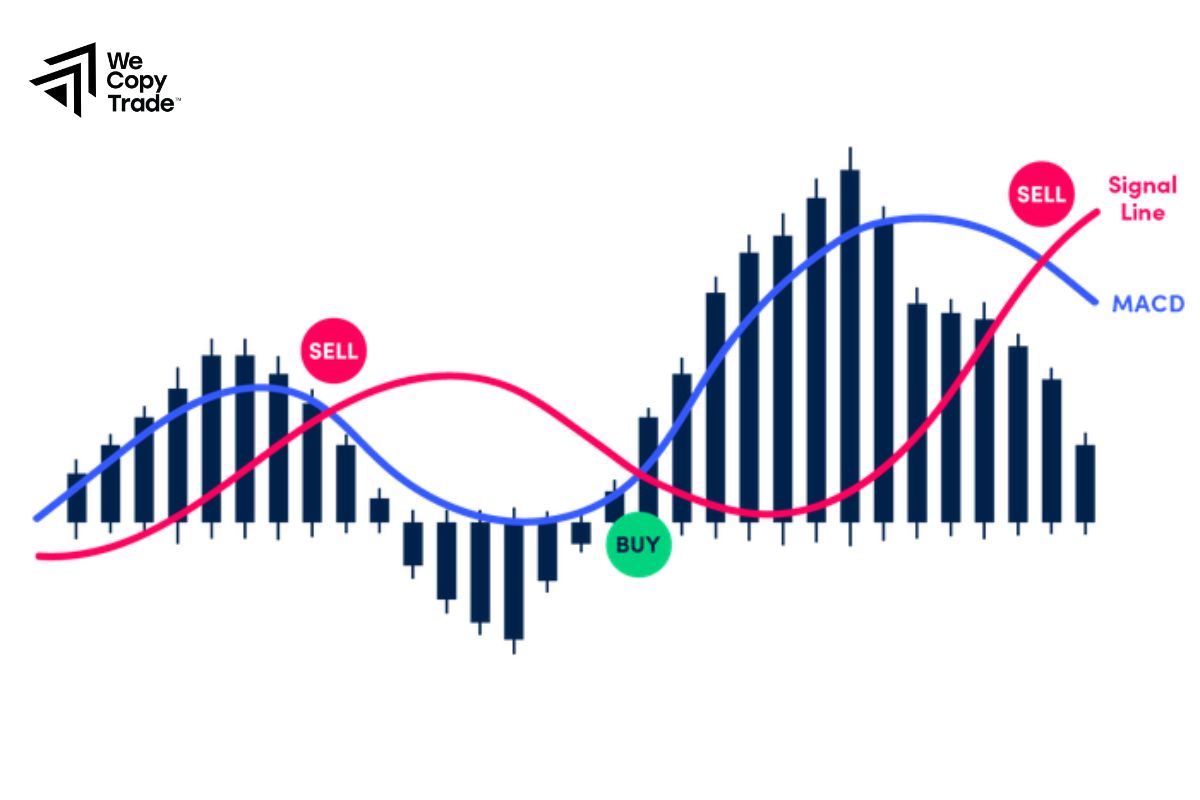
- MACD calculates the difference between two moving averages (typically 12-day and 26-day EMA). It includes a signal line (9-day EMA of the MACD) and a histogram.
- MACD is used to identify changes in the strength, direction, momentum, and duration of a trend. Signal line crossovers and histogram bars are key trading signals.
Stochastic Oscillator
- This indicator compares a particular closing price of a stock to its price range over a specified period. It ranges from 0 to 100 and includes two lines: %K and %D.
- Readings above 80 indicate overbought conditions, while readings below 20 suggest oversold conditions. Crossovers of %K and %D lines are used to signal potential trade opportunities.
Commodity Channel Index (CCI)
- CCI measures the deviation of a security’s price from its average price over a specific period. It oscillates around a zero line.
- Values above +100 indicate overbought conditions, and values below -100 suggest oversold conditions. It helps traders identify new trends or potential reversals.
Average True Range (ATR)
- ATR measures market volatility by calculating the average range between the high and low prices over a set period.
- While ATR is primarily a volatility indicator, it is useful for setting stop-loss levels and determining the strength of a trend. Higher ATR values indicate greater volatility and momentum.
Advantages and Disadvantages of Momentum Indicators
Momentum indicators are valuable tools for traders, but like any tool, they come with both advantages and disadvantages. Here’s a rundown:

Advantages of Momentum Indicators
- Momentum indicators help identify the strength and direction of trends, allowing traders to align their trades with prevailing market movements.
- They can signal optimal entry and exit points, potentially increasing trading efficiency.
- Momentum indicators can be used across various asset classes, including stocks, forex, and commodities.
- They provide quantifiable data that can be used to make objective trading decisions rather than relying on subjective judgment.
Disadvantages of Momentum Indicators
- Many momentum indicators are lagging, meaning they reflect past price movements and might not predict future trends accurately.
- They can generate false signals, especially in volatile or choppy markets where price movements are erratic.
- Traders may rely too heavily on momentum indicators and ignore other important factors like fundamental analysis or market news.
Comparing Momentum Indicators
Comparing momentum indicators involves evaluating their strengths, weaknesses, and how they align with different trading strategies. Here’s a brief comparison of some popular momentum:
| Indicator | Strengths | Weaknesses | Best For |
| RSI (Relative Strength Index) | – Identifies overbought/oversold conditions
– Simple to use |
– False signals in strong trends
– Limited trend direction |
Spotting overbought/oversold levels |
| MACD (Moving Average Convergence Divergence) | – Shows trend direction
– Signal line confirmation – Identifies trend reversals |
– Lagging indicator
– False signals in choppy markets |
Trend strength and reversals |
| Stochastic Oscillator | – Effective in overbought/oversold markets
– Crossover signals |
– False signals in trending markets
– Less reliable in trends |
Identifying potential reversals |
| CCI (Commodity Channel Index) | – Measures price deviation
– Spotting new trends/reversals |
– Volatile, false signals
– Hard to read in trending markets |
Detecting trend changes and reversals |
| ATR (Average True Range) | – Measures volatility
– Helps set stop-loss levels |
– No trend direction
– More for risk management |
Measuring market volatility |
Conclusion
In conclusion, momentum indicators are essential tools for traders seeking to understand market trends and price movements. So, for traders looking to enhance their technical analysis, understanding and applying momentum is key to optimizing trading strategies.
See now:





