












The head and shoulders pattern is one of the most commonly used patterns in analyzing price movements that help make right decisions in trading. Don’t miss your chance to become a top technical analyst. Let’s discover one of the golden secrets to making accurate predictions about these changes in the market.
What Is a Head and Shoulders Pattern?

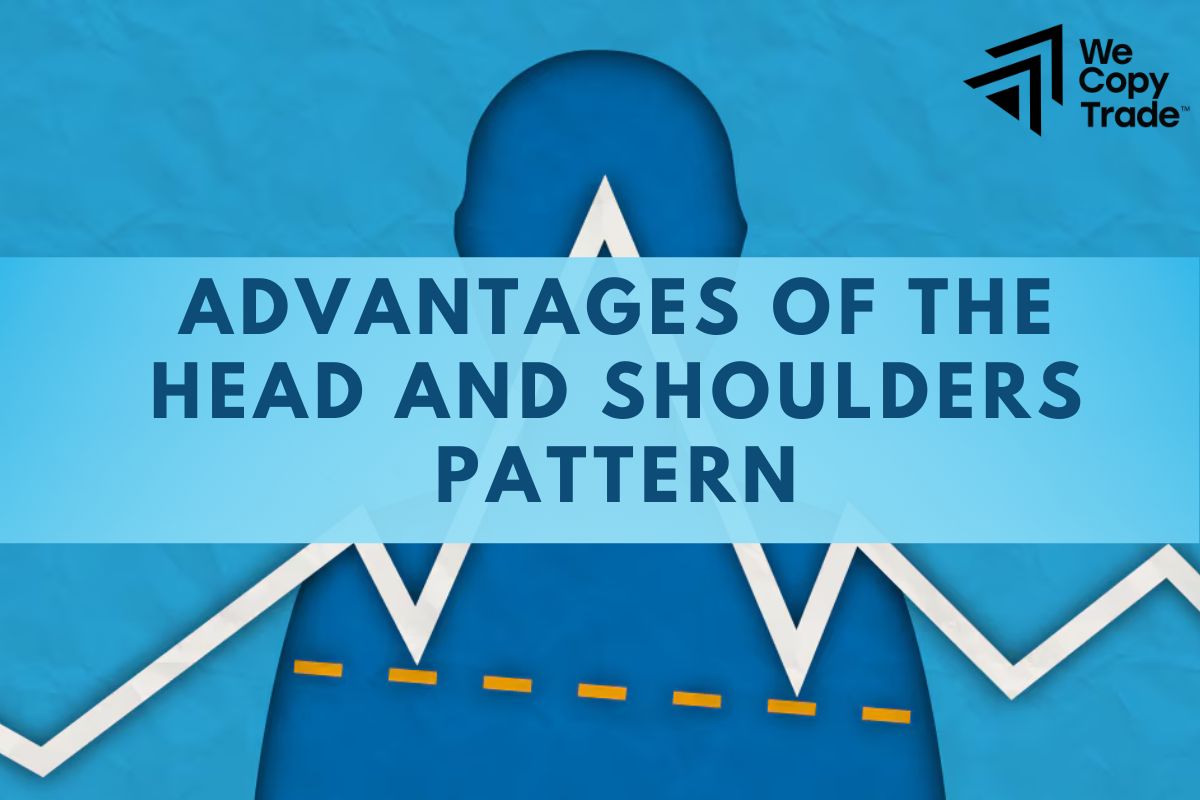
The Head and Shoulders pattern is a special type of chart pattern that is one of the most reliable reversal signals in technical analysis that helps investors predict changes in market trends. The pattern is so named because it resembles a person with his head bowed, with two shoulders on either side and a head in the middle. The shoulders are two equally high price peaks that appear at the beginning and end of the pattern. The head is the highest price peak in the pattern, located between the shoulders. And the neckline is a straight line connecting the two lowest lows between the peaks, forming a shape resembling a person’s neck. This characteristic shape is easy for investors to recognize and analyze.
When the Head and Shoulders pattern appears, it usually signals a trend reversal that the current uptrend is about to end and a new downtrend may begin.
See more:
- Top Common Types Of Chart Patterns Trading For Beginners
- Best Popular Types of Reversal Patterns Candlestick
- Symmetrical Triangle Patterns in Trading You Should Know
How does it work?
The way this pattern works is very simple and easy to understand. Specifically, when the price is in an uptrend, the left shoulder of the pattern is formed. If the price continues to rise and reaches the highest peak, it is called the head. Then, the price begins to fall and is lower than the left shoulder, forming a neckline. When the price breaks the neckline, it is a signal that a reversal may occur.
Why Is The Head and Shoulders Pattern Important?
The head and shoulders pattern is extremely effective and highly accurate. Because it works based on the general psychology of investors and the law of supply and demand in the market. When the price reaches its peak, the psychology of the majority of investors is very optimistic and they will quickly sell off, causing the price of the stock to fall sharply and break the neckline, signaling the end of a trend.
Inverse Head and Shoulders Pattern
The inverse head and shoulders pattern is also a special and most reliable chart pattern in technical analysis, which is used to predict price movements in the market. Its components are similar to the head and shoulders pattern, including 2 left and right shoulders and a head in the middle, and a neckline. However, this pattern looks like a person raising his head instead of lowering his head like in the head and shoulders pattern. The two shoulders are two low price bottoms that are almost equal, appearing at the beginning and end of the pattern.
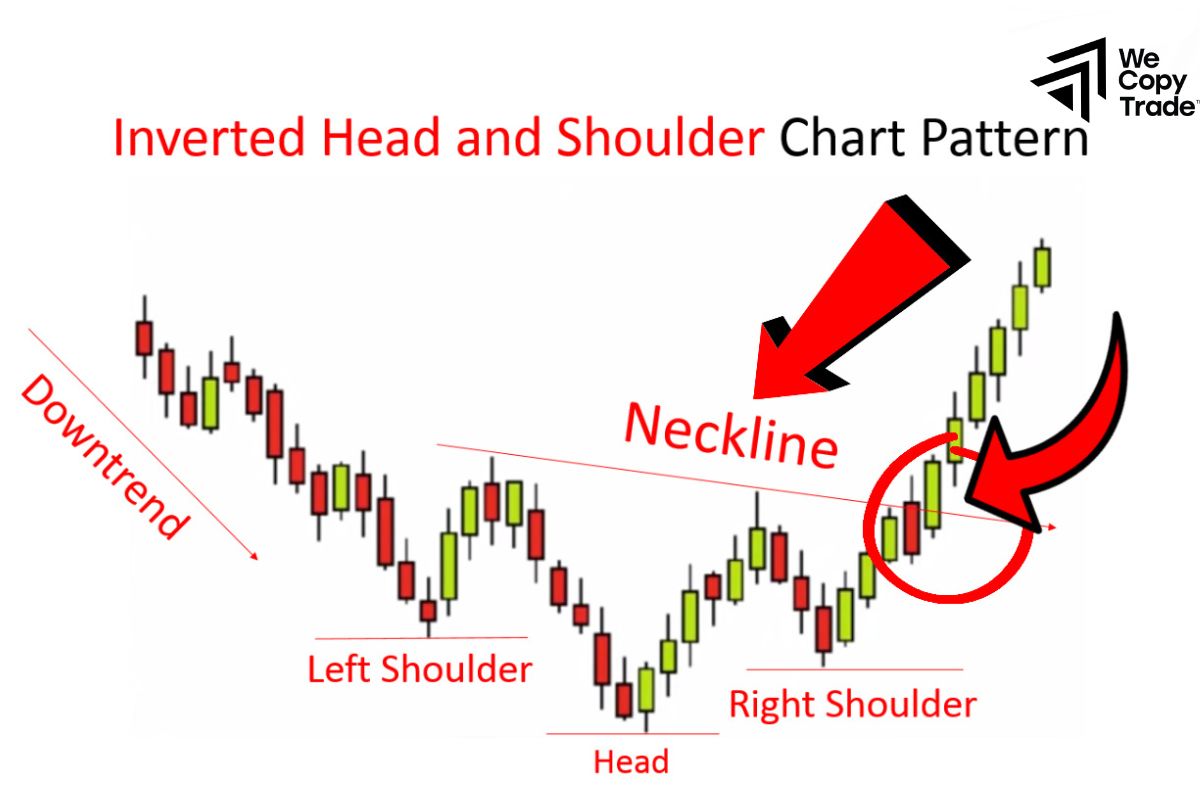
The head is the lowest price bottom in the pattern, located between the two shoulders. Finally, the neckline is a straight line connecting the two highest points between the bottoms, forming a shape similar to a person’s neck.
This pattern is very easy to recognize. When it appears on the chart, it means that there may be a reversal from bearish to bullish.
How does it work?
The formation of this pattern is very easy to understand. First, when the stock price is in a downtrend, it will form the left shoulder of the pattern. If the price continues to fall and reaches the lowest bottom, it is called the head. When the price starts to rise slightly above the level of the left shoulder, it forms a neckline. At this point, the reversal signal is confirmed.
Why is this pattern effective?
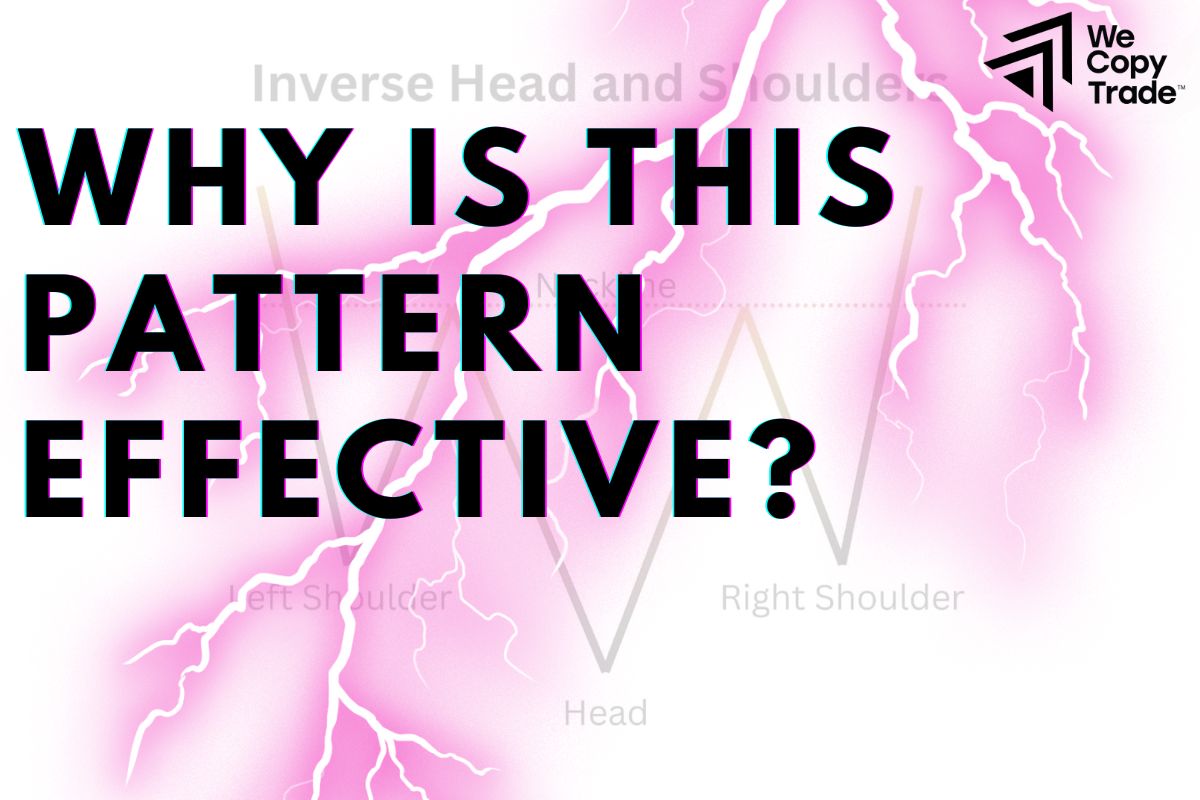
This pattern is often very accurate because it is formed and operates based on the natural laws and psychology of investors. When the stock price reaches the lowest bottom (head), investor psychology often becomes pessimistic, leading to strong buying. This causes the price to increase sharply and break the neckline, signaling the end of the downtrend.
Advantages and Disadvantages of the Head and Shoulders Pattern
The head and shoulders pattern is an extremely useful technical analysis assistant. However, besides the advantages, there are also some disadvantages that we need to pay attention to in order to limit risks. Let’s find out right away.
Advantages of the Head and Shoulders Pattern
When this pattern appears and is confirmed with certainty, this is a very reliable reversal signal, helping you to withdraw from a losing position or take advantage of opportunities in time.
- The shape of this pattern is very characteristic, easy to remember and easy to recognize even for new investors.
- This pattern helps identify important price levels such as the neckline, thereby helping investors make reasonable decisions to enter and exit orders.
Disadvantages of the Head and Shoulders Pattern
- In some cases, the price can create a shape similar to this pattern but there is no reversal. This case is called a false signal, which makes it easy for investors to make wrong decisions
- The Head and Shoulders pattern often takes a certain amount of time to complete. This can cause investors to miss out on short-term trading opportunities.
- The Head and Shoulders pattern is just one of many factors to consider when making an investment decision. Other factors such as news, events, and other technical indicators can also affect price.
Trading the Inverse Head and Shoulders Pattern
Here are some effective ways we need to know when deciding to trade based on the head and shoulders tool:
Waiting for the completion of the pattern and trading entries
As mentioned above, the head and shoulders pattern takes a certain amount of time to complete. Therefore, we need to determine whether the pattern has been completed or not, avoid confusing it with false signals to make the right trading decision.
Common trading entries:
Breakout of the neckline: This is the most common entry point. When the price breaks the neckline in the direction of confirming the pattern (upwards for the Inverse Head and Shoulders pattern), the investor can open a buy position.
Retreat to the neckline: This is a more conservative entry point. After the price has broken the neckline, the investor can wait for the price to return to test the neckline again as a new support level. If the price bounces from this level, the investor can enter a buy order.
Trading Plan
Before entering any trade, investors should create a detailed trading plan, including entry points, stop loss points, profit targets, and changing conditions.
Conclusion
In conclusion, both the Head and Shoulders and the Inverse Head and Shoulders pattern are extremely useful and easy to use technical analysis tools. They help investors predict market reversals and make timely decisions. However, no tool is perfect, so combining different elements will help you increase your chances of trading success.





