












The symmetrical triangle pattern is an important tool in technical analysis, often indicating a potential breakout in a market trend. This pattern is formed when the price of an asset converges between two trend lines that meet at a point, forming a triangle. So, follow this article to understand more!
What is a Symmetrical Triangle Pattern?
A Symmetrical Triangle Pattern is a chart pattern used in technical analysis that indicates a period of consolidation before a potential breakout in either direction. It forms when an asset’s price moves between two converging trendlines: one sloping downward and the other sloping upward. These trendlines create a triangular shape that becomes narrower over time.
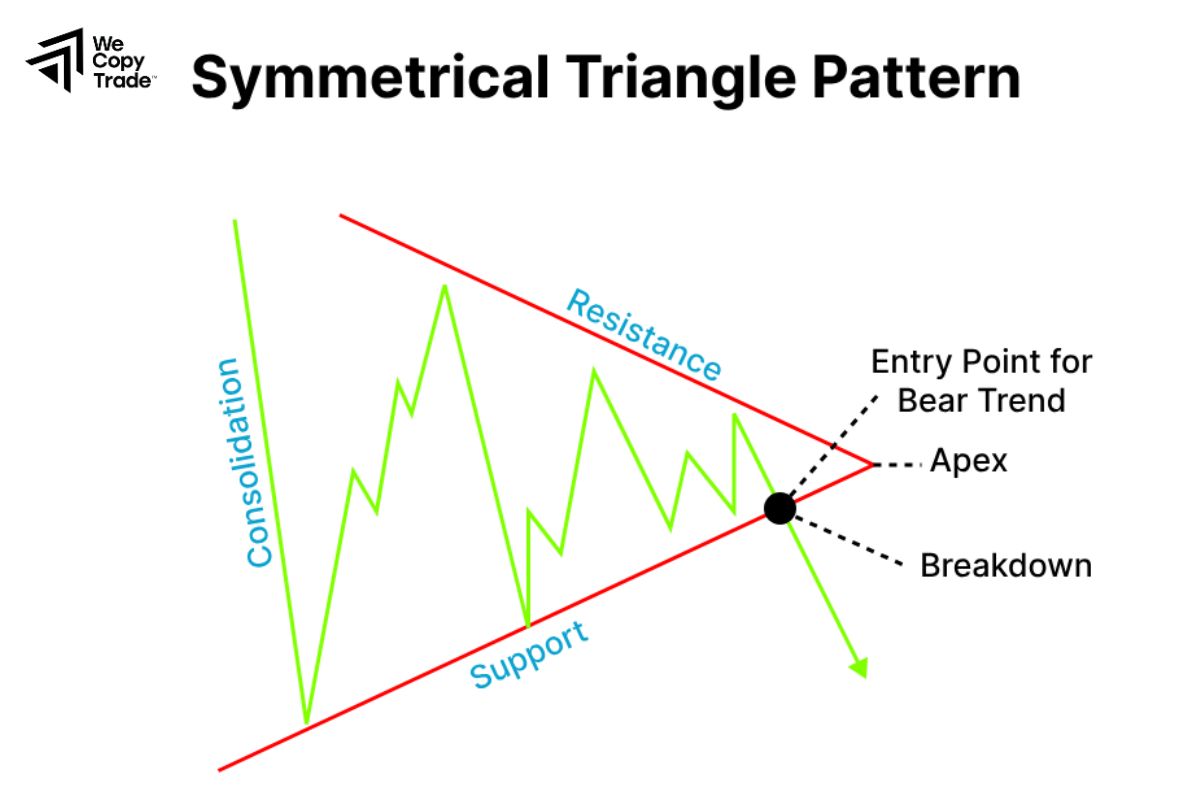
This pattern signals market indecision, as neither buyers or sellers have full control. The price consolidates as it oscillates between these narrowing trendlines, and a breakout typically occurs when the price moves beyond one of the trendlines with strong momentum. The breakout direction could be bullish above the upper trendline or bearish below the lower trendline, depending on market forces.
Key features of a Symmetrical Triangle Pattern include:
- Converging Trendlines: The highs get progressively lower, while the lows get progressively higher.
- Neutral Bias: It doesn’t inherently suggest a bullish or bearish outcome but is a sign of pending price movement.
- Breakout Potential: A significant breakout typically occurs before the pattern reaches its apex.
How are Ascending and Descending Symmetrical Triangle Pattern Different?
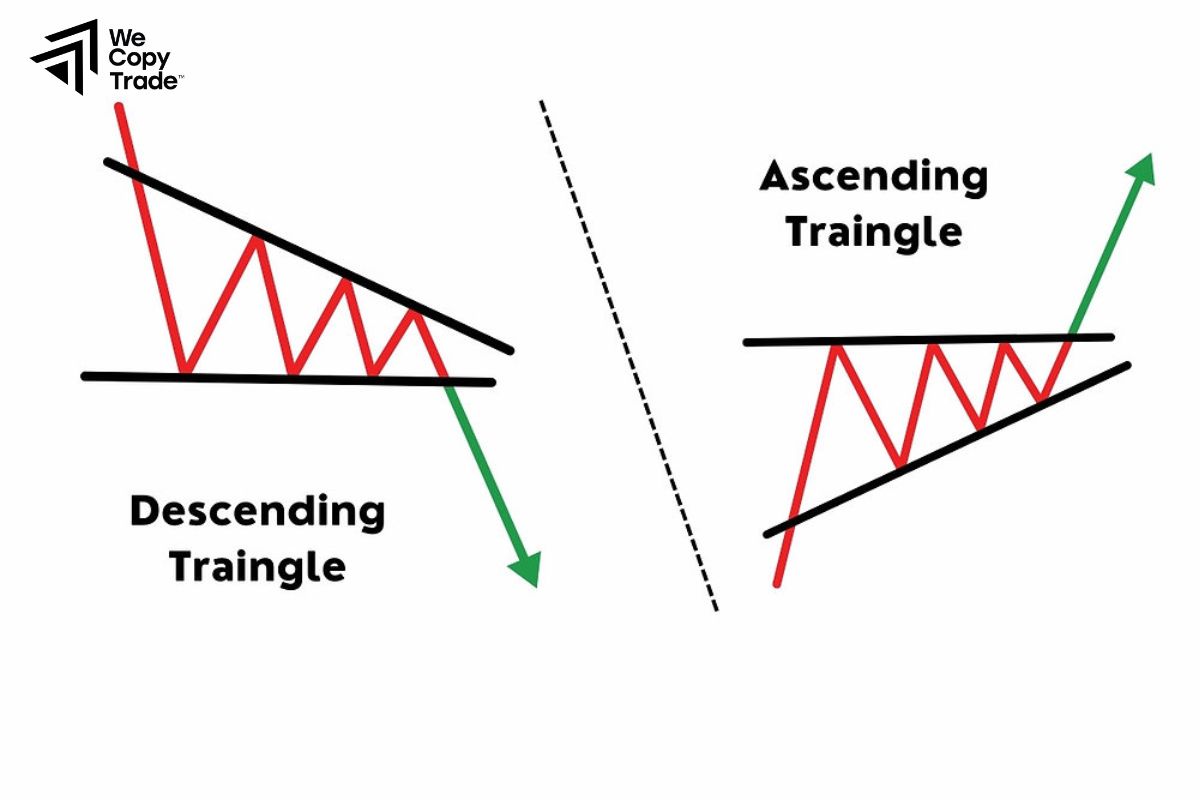
Ascending and Descending Triangles differ from Symmetrical Triangle Pattern primarily in the structure of their trendlines and their implications for price direction:
Ascending Triangle
- It has a horizontal resistance line (on top) and an upward-sloping support line (on the bottom). The price forms higher lows but doesn’t break through the resistance.
- This pattern typically indicates bullish momentum, showing that buyers are gaining strength. It’s expected that the price will break above the resistance and move higher.
Descending Triangle
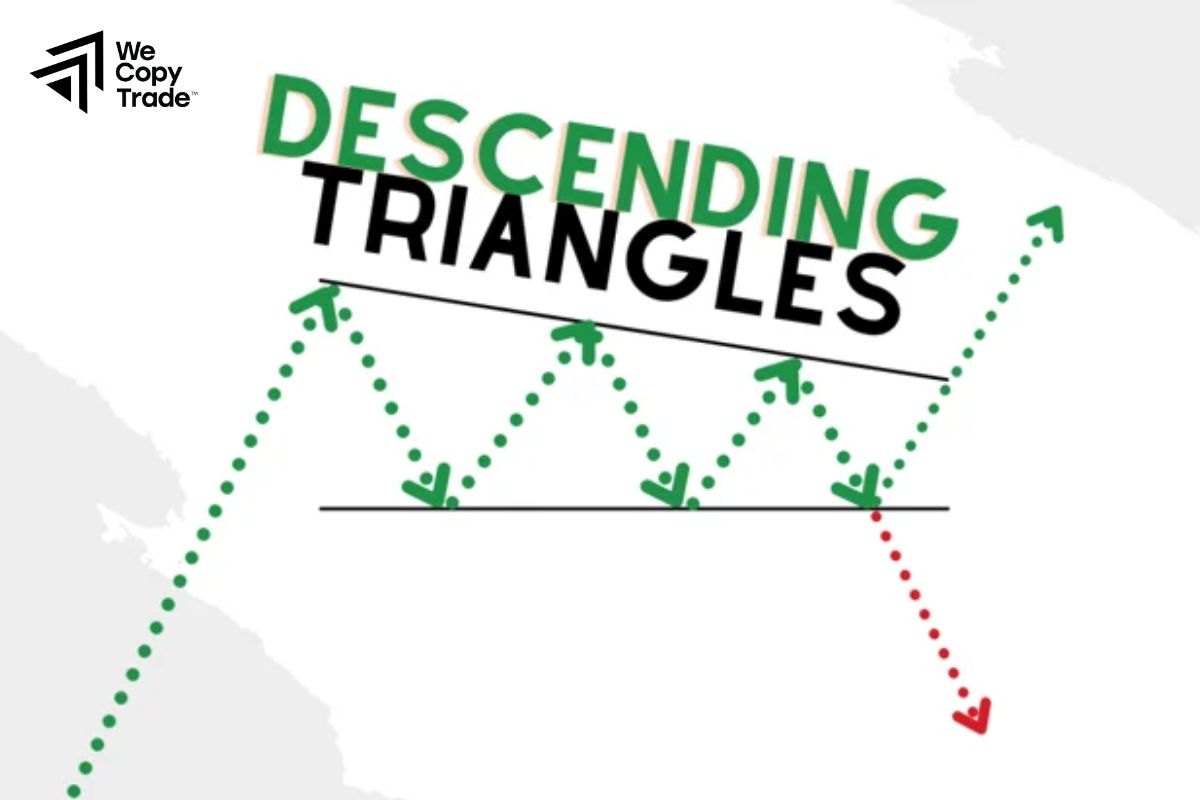
- It has a horizontal support line (on the bottom) and a downward-sloping resistance line (on top). The price forms lower highs, indicating increasing selling pressure.
- This pattern typically signals a bearish trend, showing that sellers are in control. The price is expected to break below the support and move lower.
Some Types of Symmetrical Triangles in Trading
In trading, there is technically only one Symmetrical Triangle Pattern, but traders can encounter variations based on market context and interpretation. While the symmetrical triangle itself is neutral, the pattern can take on different forms based on certain conditions:
Continuation Symmetrical Triangle
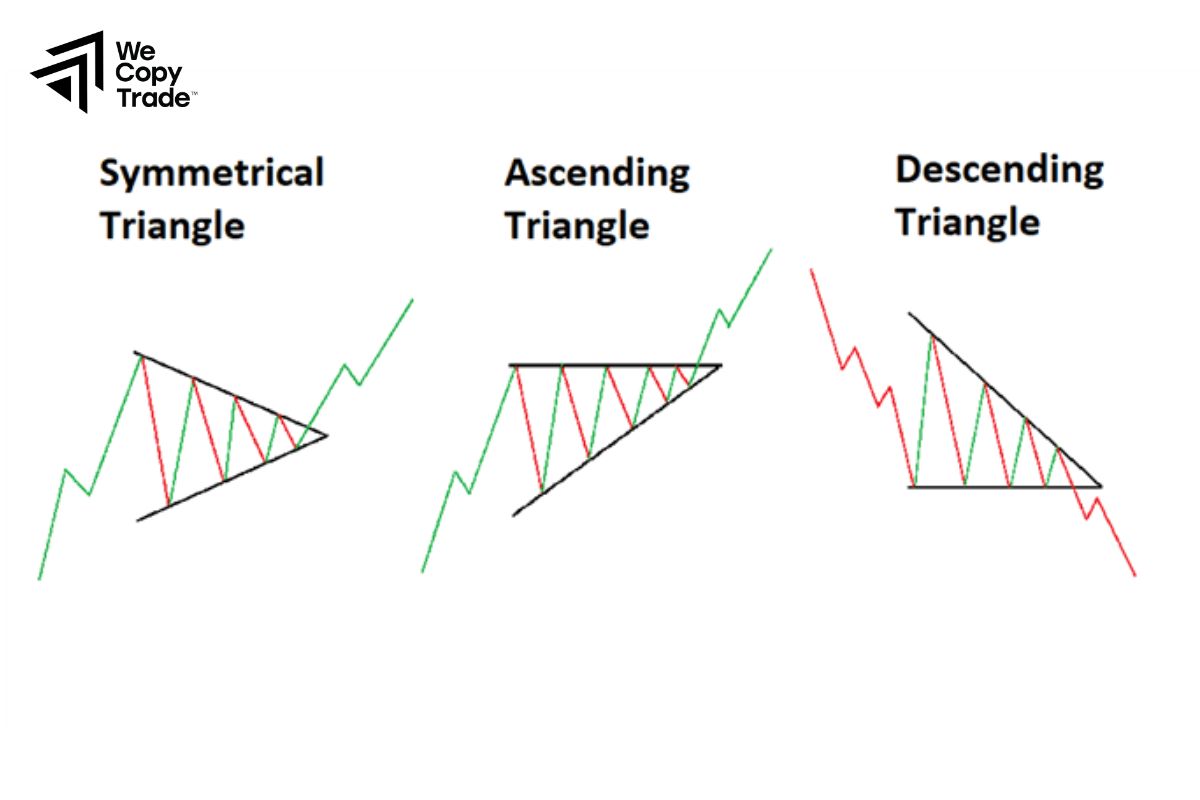
- This occurs during an existing trend (bullish or bearish) and is seen as a pause or consolidation before the trend resumes.
- If formed during an uptrend, it often leads to an upward breakout; if during a downtrend, it could signal a downward breakout.
Reversal Symmetrical Triangle
- This variation happens when a market trend is losing strength, leading to a potential reversal.
- After the breakout, the price may move in the opposite direction of the prior trend, marking a trend reversal patterns.
Bilateral Symmetrical Triangle
- This occurs in highly volatile markets where price direction is uncertain.
- The breakout could occur in either direction, and traders often wait for confirmation before entering a position.
Long-Term vs. Short-Term Symmetrical Triangle
- Long-term triangles develop over weeks or months, signaling bigger potential price moves.
- Short-term triangles form over days or hours, often leading to more immediate but smaller price changes.
Strategies for Symmetrical Triangle Chart Patterns
When trading Symmetrical Triangle Pattern, several strategies can help you take advantage of potential breakout. Here are some effective strategies:
- Wait for a Confirmed Breakout: Enter the trade after the breakout, confirming with increased trading volume to avoid false signals.
- Set Stop-Loss Orders: Place the stop-loss slightly below the lower trendline (for a bullish breakout) or above the upper trendline (for a bearish breakout).
- Use a Measured Move Target: Set profit targets using this measured move technique to gauge potential gains.
- Wait for a Retest of the Breakout: If the price retests the breakout line and holds, enter the trade, as this confirms the validity of the breakout.
- Watch Volume for Confirmation: Use volume as a confirming indicator before entering trades based on a Symmetrical Triangle breakout.
Can a False Breakout Occur in a Symmetrical Triangle Pattern?

Yes, false breakouts can occur in a Symmetrical Triangle Pattern when the price briefly breaks the trendline but quickly reverses. This is often due to low trading volume, market manipulation, or sudden changes in sentiment. To avoid false breakouts, traders should wait for confirmation with strong volume, use stop-losses to manage risk, and check multiple timeframes to verify the breakout’s validity.
Are There Any Chart Patterns Similar to Symmetrical Triangles?
Yes, several chart patterns are similar to Symmetrical Triangle Pattern. The Ascending Triangle features a flat upper trendline and a rising lower trendline, indicating bullish sentiment and a likely breakout above resistance. The Descending Triangle has a flat lower trendline and a descending upper trendline, suggesting bearish sentiment with a potential breakout below support.
Besides, Wedge Patterns which include rising and falling wedges, also have converging trend lines and indicate potential reversals. Lastly, Pennants are formed after strong price movements and signal the continuation of the previous trend after a breakout. Each of these patterns can provide valuable insights for traders.
The Main Difference Between Symmetrical Triangle Pattern and Pennants
The main difference between Symmetrical Triangle Pattern and Pennants lies in their formation and the context in which they appear:
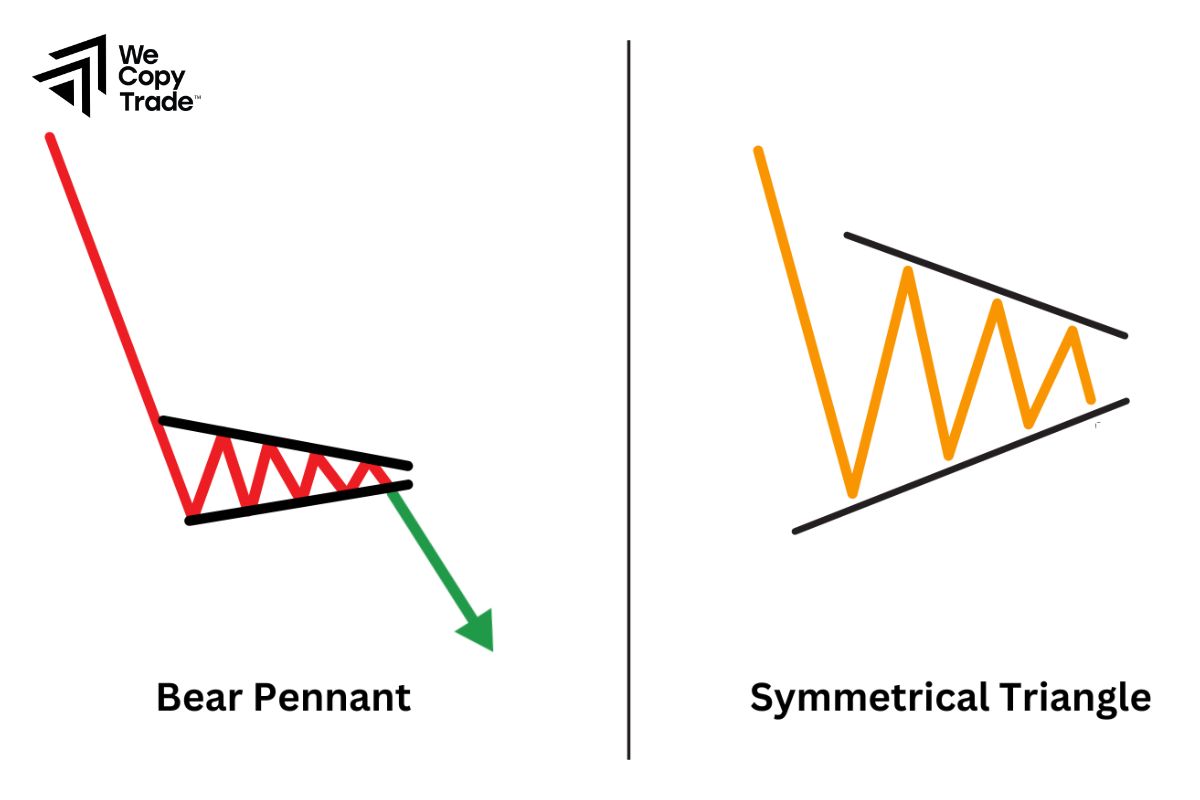
| Criteria | Symmetrical Triangle Pattern | Pennants |
| Shape | Two converging trendlines (one upward, one downward) | Two smaller converging trendlines |
| Formation Duration | Typically lasts for several weeks or months | Usually lasts for a few days or weeks |
| Context | Indicates market indecision, can break in either direction | A continuation pattern, indicating that the prior trend will continue |
| Characteristics | Does not favor either side (bullish or bearish) | Favors the previous trend (bullish or bearish) |
| Volume | Volume often decreases throughout the formation | Volume typically increases significantly upon breakout |
Conclusion
In conclusion, the Symmetrical Triangle Pattern is an essential chart formation that can signal potential breakouts and trading opportunities. Start incorporating the Triangle Pattern into your analysis today, and unlock new trading possibilities. Don’t miss out stay ahead in the market by mastering this powerful tool!





