












You want to try trading but have too many questions and don’t know where to start. Chart Patterns Trading will be your reliable companion.Let’s write your own recipe book for successful trading right now!
What is a Chart Patterns Trading?
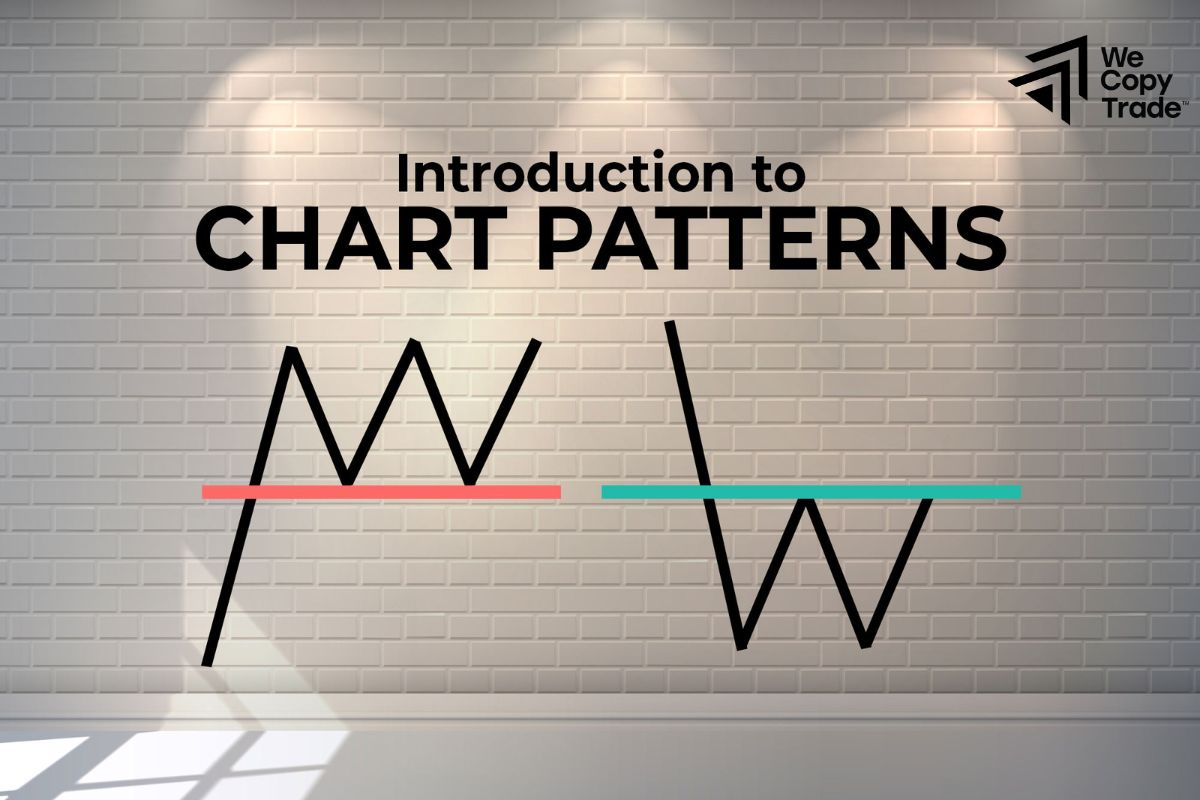
A patterns trading is a chart that shows price movements that have occurred in the past. The main purpose of this chart is to help traders make more accurate predictions if the old price pattern repeats itself again. Identifying and understanding these patterns helps traders increase their chances of capturing effective trading opportunities.
Common Types of Chart Patterns Trading
There are many popular chart patterns trading used to predict market prices. Here are 11 of the most commonly used chart types:
Head and Shoulders Pattern
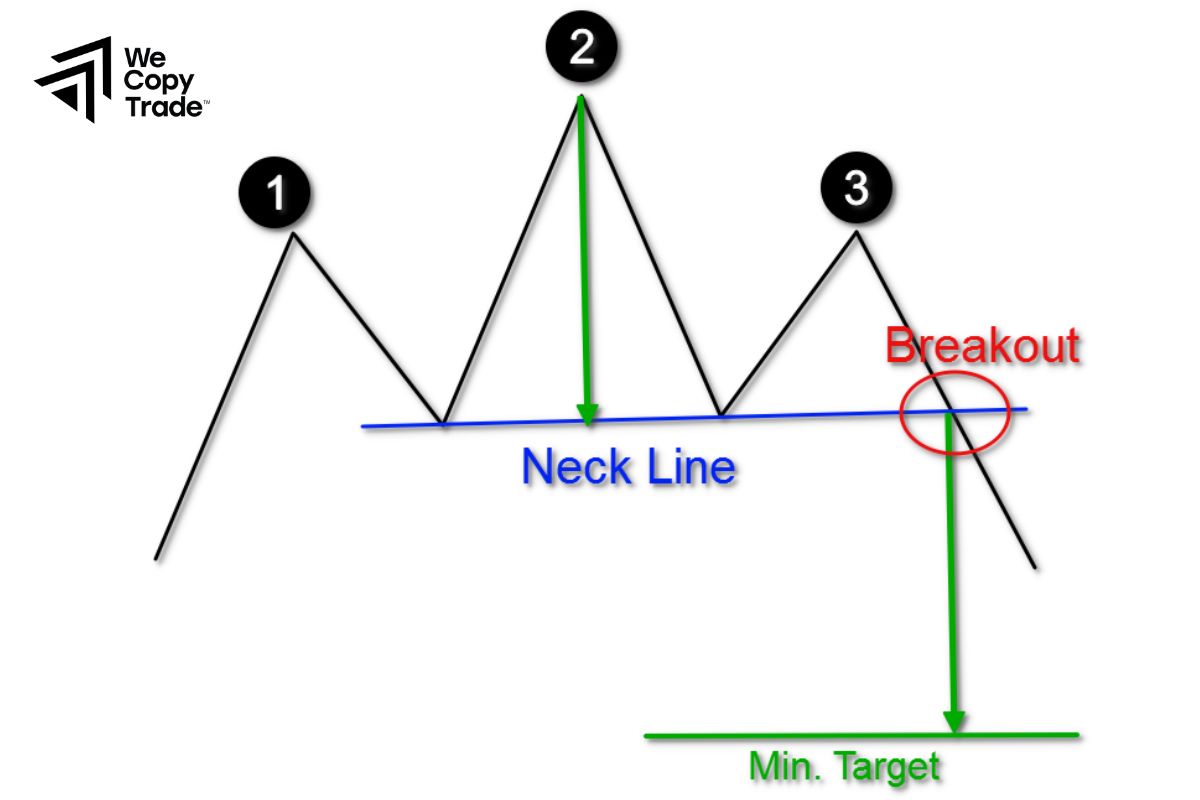
This is one of the most common chart patterns trading, often signaling a trend reversal. It looks like a head with two shoulders. The middle peak (head) is higher than the two side peaks (left and right shoulders).
When the price forms this patterns trading, it shows that buying pressure is weakening and a strong sell-off may occur to push the price down.
When the price breaks the neckline – the line connecting the lowest points of the left and right shoulders – it is a strong signal that a downtrend is about to begin.
Inverse Head and Shoulders
The Inverse Head and Shoulders pattern is in contrast to the Head and Shoulders pattern. Instead of peaks, this patterns trading consists of three troughs. The middle trough (head) is lower than the two side troughs (shoulders). This pattern shows that selling pressure is weakening and that a strong buying wave may occur to push the price up. When the price breaks the neckline, it is a buy signal.
Double Top and Double Bottom Patterns
Price reaches a peak, then declines and rises again near the initial peak before declining again. These two peaks form an M shape. In contrast to the double top, price forms two lowest bottoms at approximately the same level. The shape of the double bottom resembles the letter W. Both patterns trading indicate market indecision at a particular price level. When price breaks the support line (double bottom) or resistance line (double top), it usually signals a trend reversal.
Triple Top and Triple Bottom Patterns
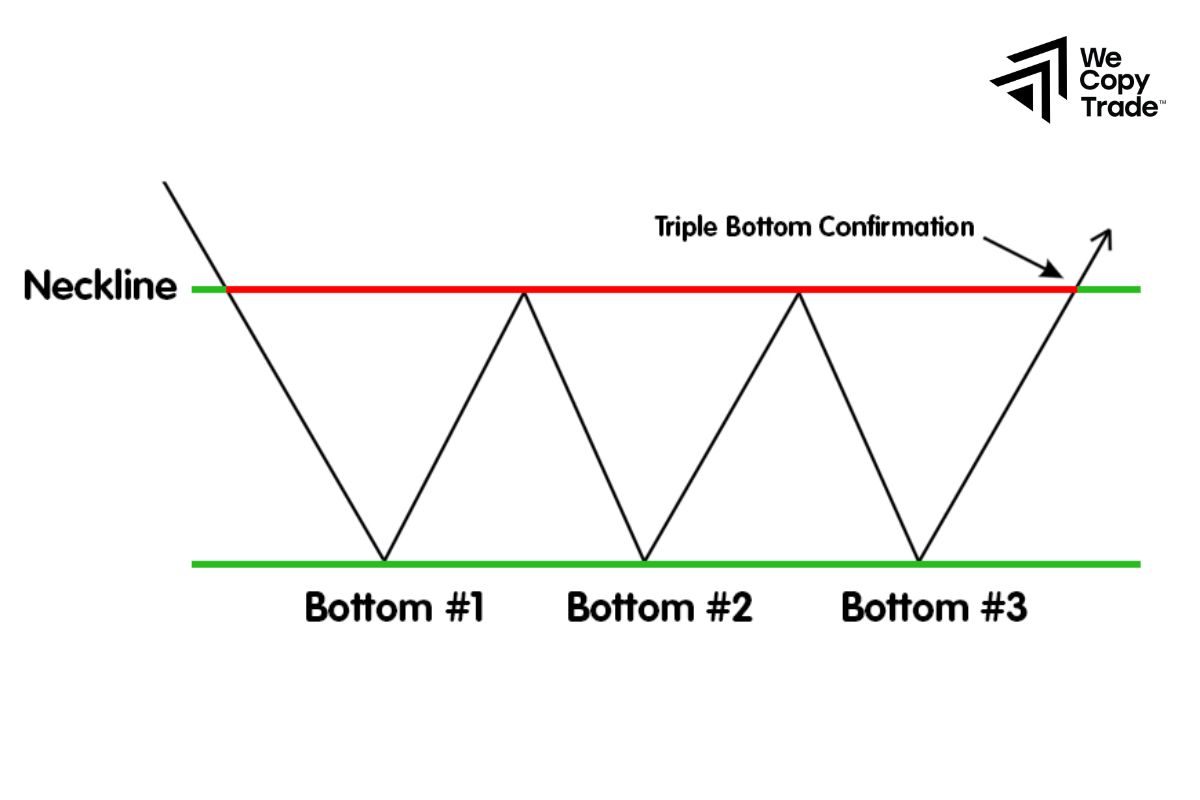
The Triple Top pattern shows that if the price reaches the highest peak three times in a row, it shows that buying pressure is weakening. When the price breaks the support line (the line connecting the lowest points of the three peaks), it is a strong signal that a downtrend is about to start.
In contrast to the triple top, the triple bottom shows that the price reaches the lowest point three times in a row at nearly the same level. This shows that selling pressure is weakening. When the price breaks the resistance line (the line connecting the highest points of the three bottoms), it is a buy signal.
Ascending Triangle Pattern
This pattern shows the price caught between a horizontal resistance line and an upward sloping support line. Each time the price touches the resistance line, it is pushed down, but the next time it bounces back up a little higher. This shows that buying pressure is getting stronger and the possibility of the price breaking the resistance line and going up is very high.
Descending Triangle Pattern
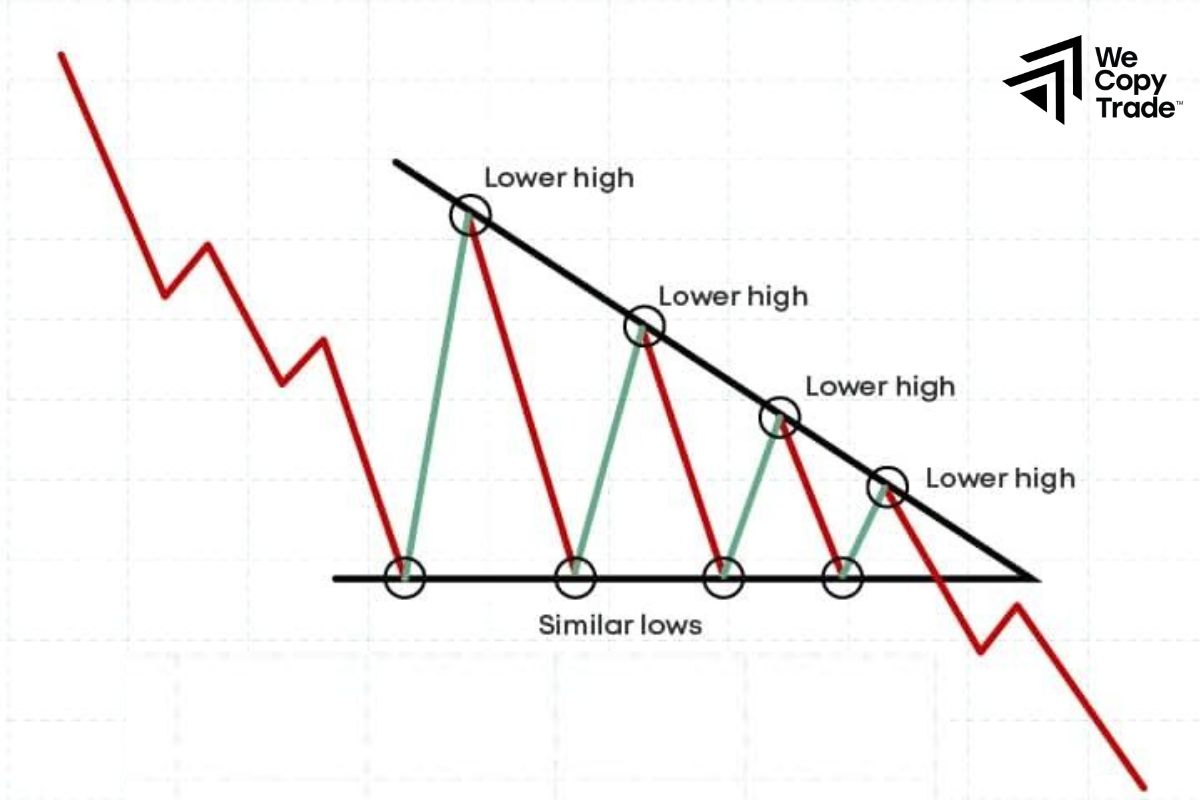
The opposite of the ascending triangle, this patterns trading shows the price caught between a horizontal support line and a downward sloping resistance line. Each time the price touches the support line, it is pushed up, but the next time, it falls a little lower. This shows that the selling pressure is getting stronger and the possibility of the price breaking the support line and falling is very high.
Symmetrical Triangle Pattern
This pattern resembles a symmetrical triangle, with both the resistance and support lines narrowing towards each other. The price fluctuates between these two lines, forming increasingly close tops and bottoms. This patterns trading shows market instability and the possibility of price breaking out in either direction, up or down.
Cup and Handle Pattern
This pattern looks like a coffee cup with a handle. The cup is a circular curve, indicating a price recovery after a decline. The handle is a small decline immediately after, before the price continues to rise sharply.
This patterns trading shows an accumulation of buying pressure and signals the beginning of a new uptrend. When the price breaks the resistance line of the handle, it is a very strong buy signal.
Wedge Pattern
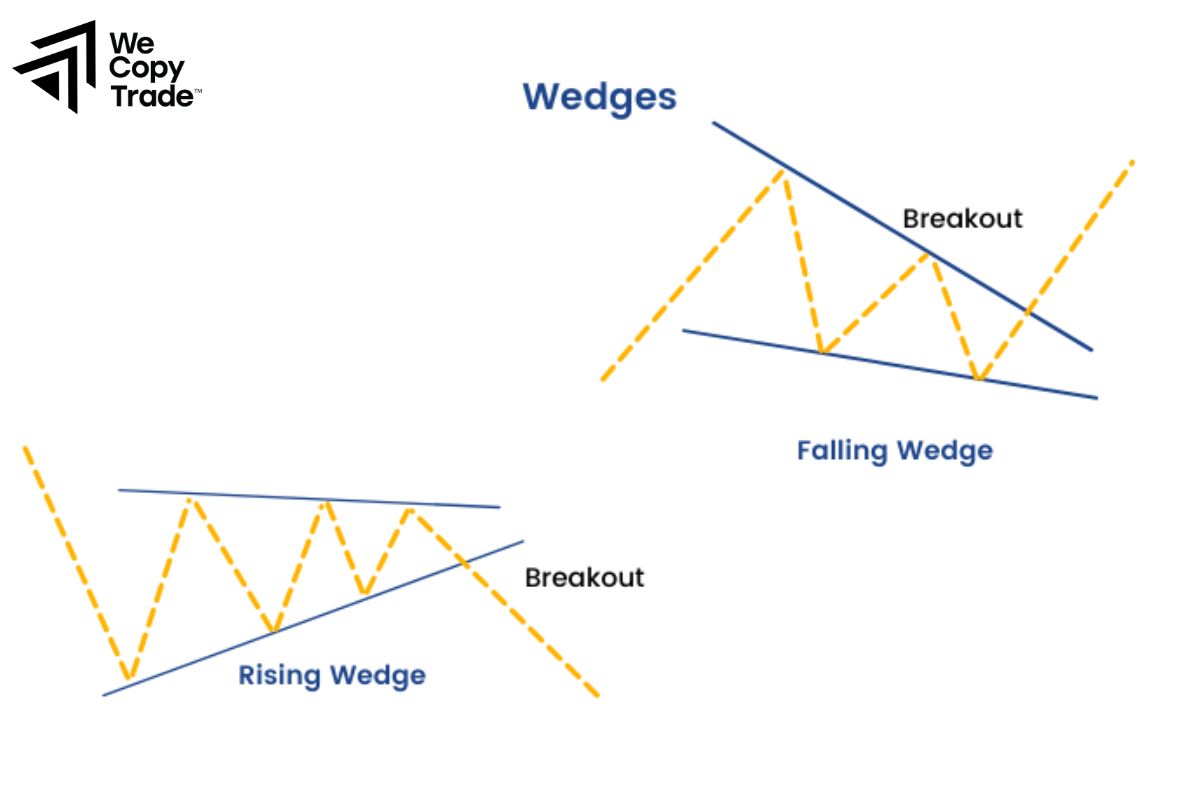
- Rising Wedge: Forms when trend lines converge, forming a wedge that narrows at the top. Despite its name, this patterns trading usually signals a reversal from a downtrend to an uptrend.
- Declining Wedge: The opposite of the rising wedge, the falling wedge has a narrower shape at the bottom and usually signals a reversal from an uptrend to a downtrend.
- The wedge pattern shows an imbalance between supply and demand, and when the price breaks the trend line, it usually signals a strong change in trend.
Pennant Pattern
This patterns trading resembles a flag fluttering on a flagpole. The flagpole is a sharp rise or fall in price, and the flag is a small triangle, indicating a short-term correction.
The pennant pattern indicates a brief pause in a strong trend. When price breaks the flag’s trendline, it usually continues in the direction of the original trend.
Flag Pattern
The flag pattern resembles a flying flag, but the flag is rectangular instead of triangular. Similar to the pennant pattern, the flag pattern also shows a brief pause in a strong trend. When the price breaks the trend line of the flag, it usually continues in the direction of the original trend.
How to use these charts in trading
Price charts play an extremely important role in making accurate price decisions. Especially when trading on short-term time frames, combining multiple analytical tools will help you make more accurate decisions. To make the most of chart patterns trading, we should:
- Combine with technical indicators: Indicators such as RSI, MACD, Bollinger Bands… can further confirm the reliability of a pattern.
- Use candlestick patterns: Candlestick patterns such as hammer candles, closing candles, reversal candles… can provide additional information about market sentiment and further confirm signals from the pattern.
- Determine entry points and place tight stop losses: Once you have identified a potential pattern, place the order at the appropriate location and set a stop loss at a reasonable level to limit risk.
- Effective capital management: Divide the trading capital and do not put too much money into a single transaction.
- Stay informed about the market: Keep track of news, economic events and other fundamental factors that can affect the market.
Conclusion
In conclusion, surely through the golden secrets from the patterns trading that I just shared above, you have enough confidence to make well-founded predictions of potential price changes, thereby gaining profits and minimizing risks.
See more:





