













The Ascending Triangle is a powerful chart pattern used by traders to predict bullish market trends, often signaling a breakout above a resistance level. Whether you are a seasoned trader or just starting out, mastering the Ascending Triangle can lead to more profitable trades. Want to improve your trading game? Start analyzing Ascending Triangles today!
What is an ascending triangle pattern?
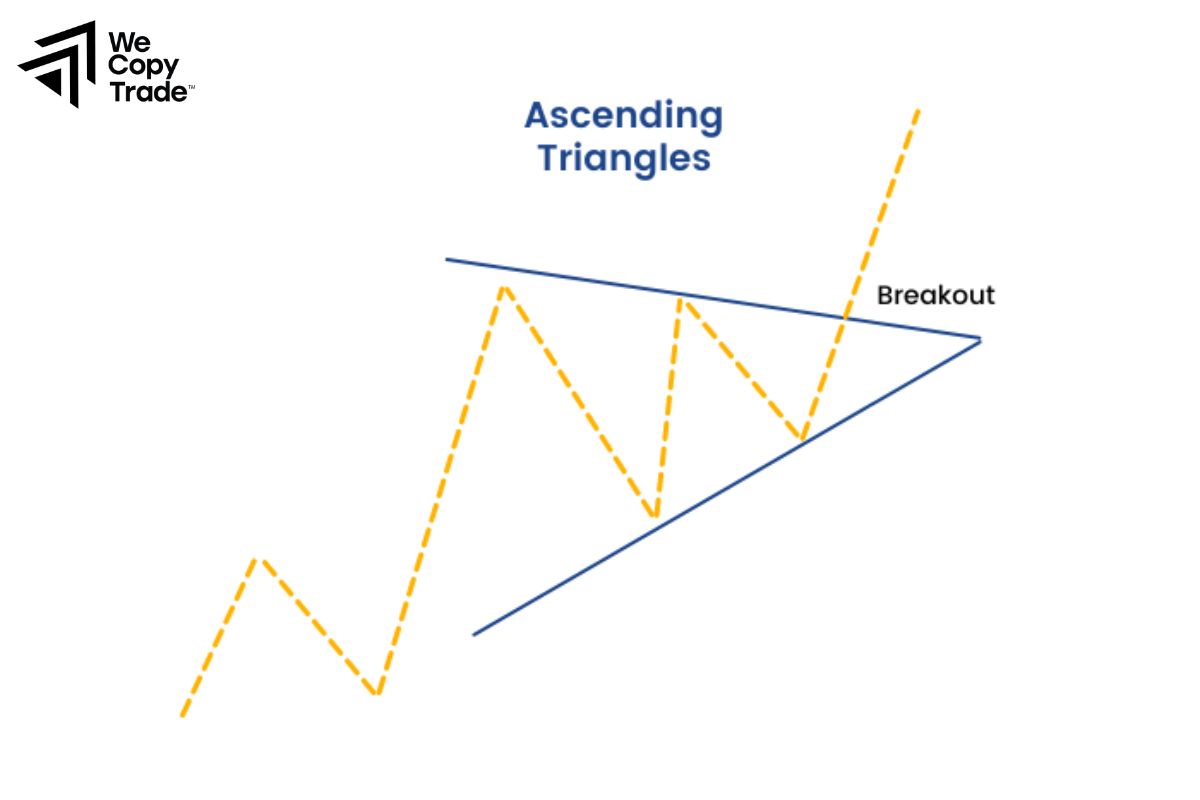
An Ascending Triangle is a bullish continuation pattern in trading, featuring a horizontal resistance line at the top and an upward-sloping support line at the bottom. This pattern indicates that buyers are becoming more aggressive while sellers hold a steady resistance level.
Key Points:
- Horizontal Resistance: A flat upper line where prices often struggle to break through.
- Upward-Sloping Support: A rising lower line showing increasing buying pressure.
- Breakout Strategy: Traders typically enter long positions when prices break above the resistance level, ideally with increased volume.
This pattern suggests potential bullish movement, making it a valuable tool for trader looking to enhance their strategies. Recognizing the Ascending Triangle can lead to informed trading decisions and improved profit opportunities.
Components of an Ascending Triangle
The Ascending Triangle pattern consists of several key components that help traders identify and analyze potential bullish trends. Here are the main components:
Horizontal Resistance Line
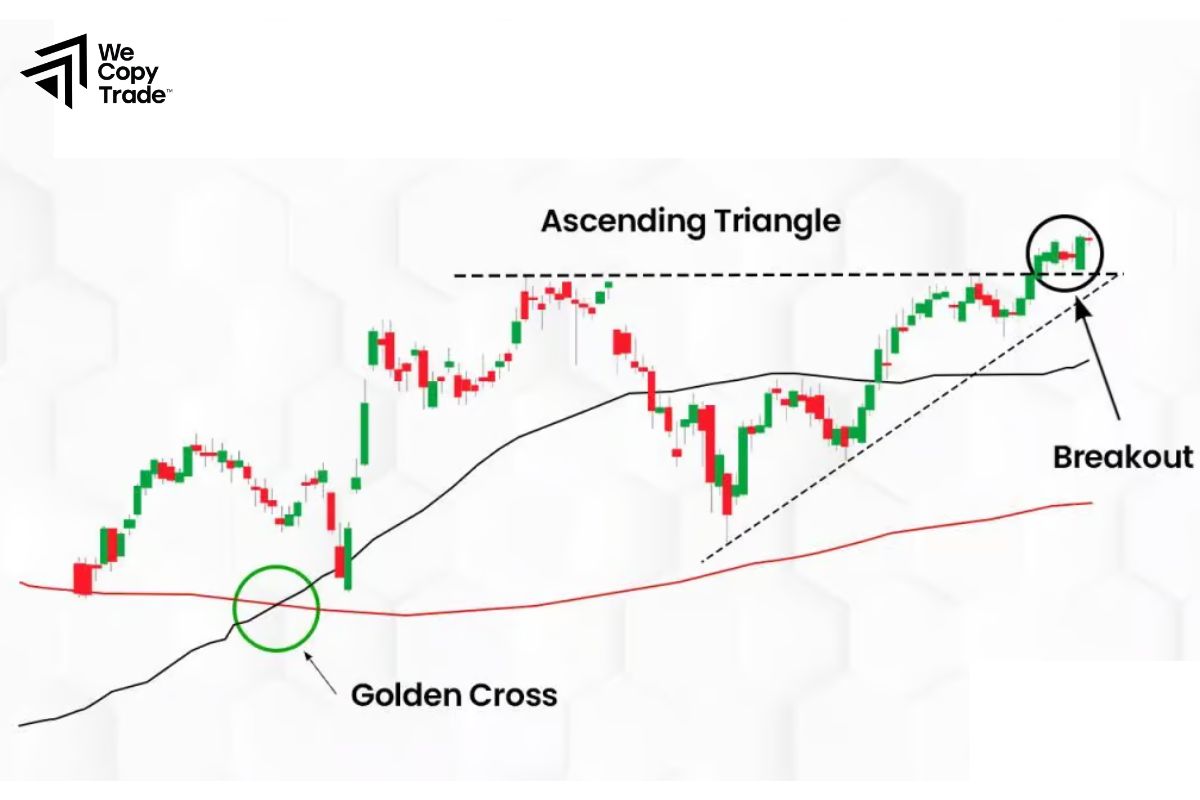
- This is the top boundary of the triangle, formed by multiple peaks where the price struggles to break through.
- It indicates a consistent selling pressure at that price level.
Upward-Sloping Support Line
- This is the bottom boundary of the triangle, created by a series of higher lows.
- It reflects increasing buying pressure, suggesting that buyers are gradually pushing the price higher.
Price Action
- The price moves within the triangle, typically bouncing between the horizontal resistance and the upward-sloping support.
- The pattern is confirmed when the price approaches the apex of the triangle, where the two lines converge.
Volume Patterns
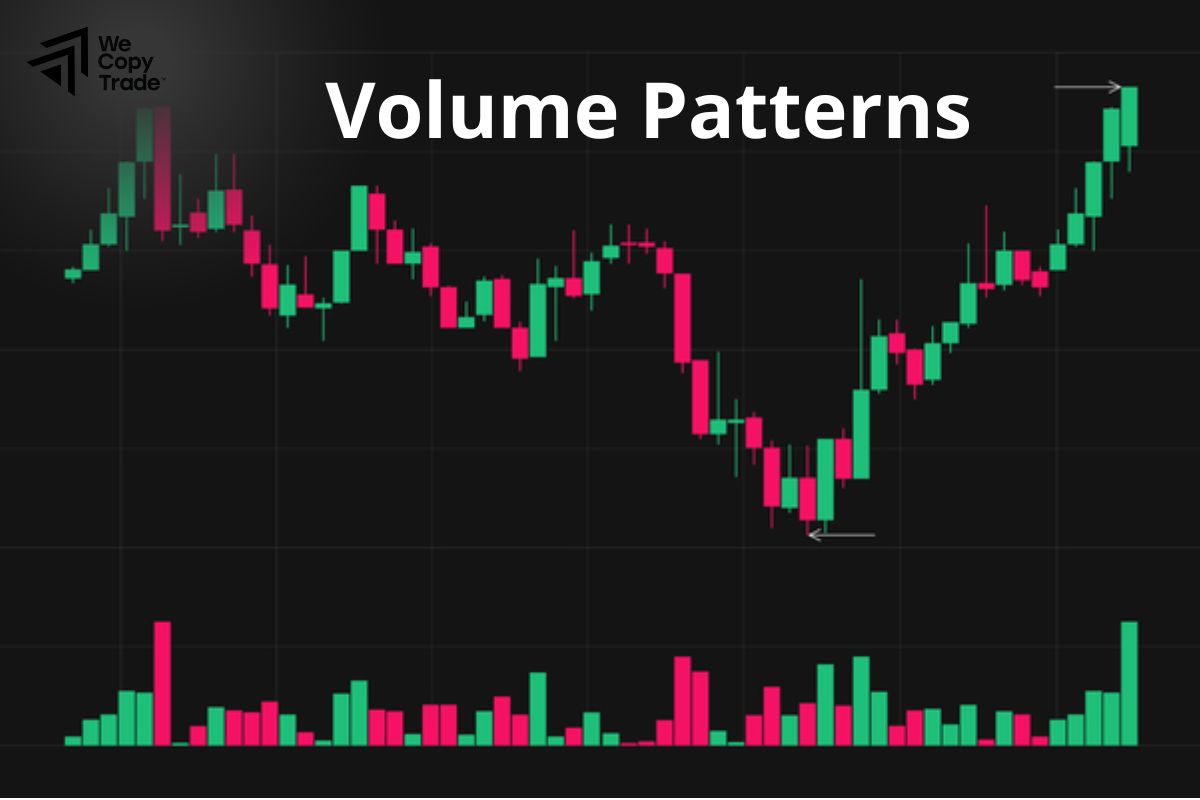
- Volume often decreases as the pattern develops, indicating a period of consolidation.
- A significant increase in volume during the breakout confirms the strength of the move.
Breakout Point
- The breakout occurs when the price breaks above the horizontal resistance line, ideally accompanied by a surge in volume.
- This breakout is a key signal for traders to enter long positions.
Price Target
- The potential price target after a breakout can be calculated by measuring the height of the triangle (the distance between the highest point of resistance and the lowest point of support) and projecting that distance upward from the breakout point.
How to Trade an Ascending Triangle Most Effectively
Trading an Ascending Triangle effectively requires a clear understanding of the pattern, strategic entry and exit points, and proper risk management. Here’s how to approach it:

Identify the Pattern
- Look for the distinct features of an Ascending Triangle: a horizontal resistance line at the top and an upward-sloping support line at the bottom.
- Ensure the pattern forms over several price swings to confirm its validity.
Confirm with Volume
- Observe volume trends as the pattern develops. Typically, volume decreases during consolidation and should increase significantly at the breakout.
- A volume spike during the breakout can confirm the strength of the move.
Set Entry Points
- Buy Signal: Consider entering a long position once the price breaks above the horizontal resistance line, ideally with increased volume.
- You might place a buy stop order slightly above the resistance to ensure entry after the breakout.
Determine Stop-Loss Levels
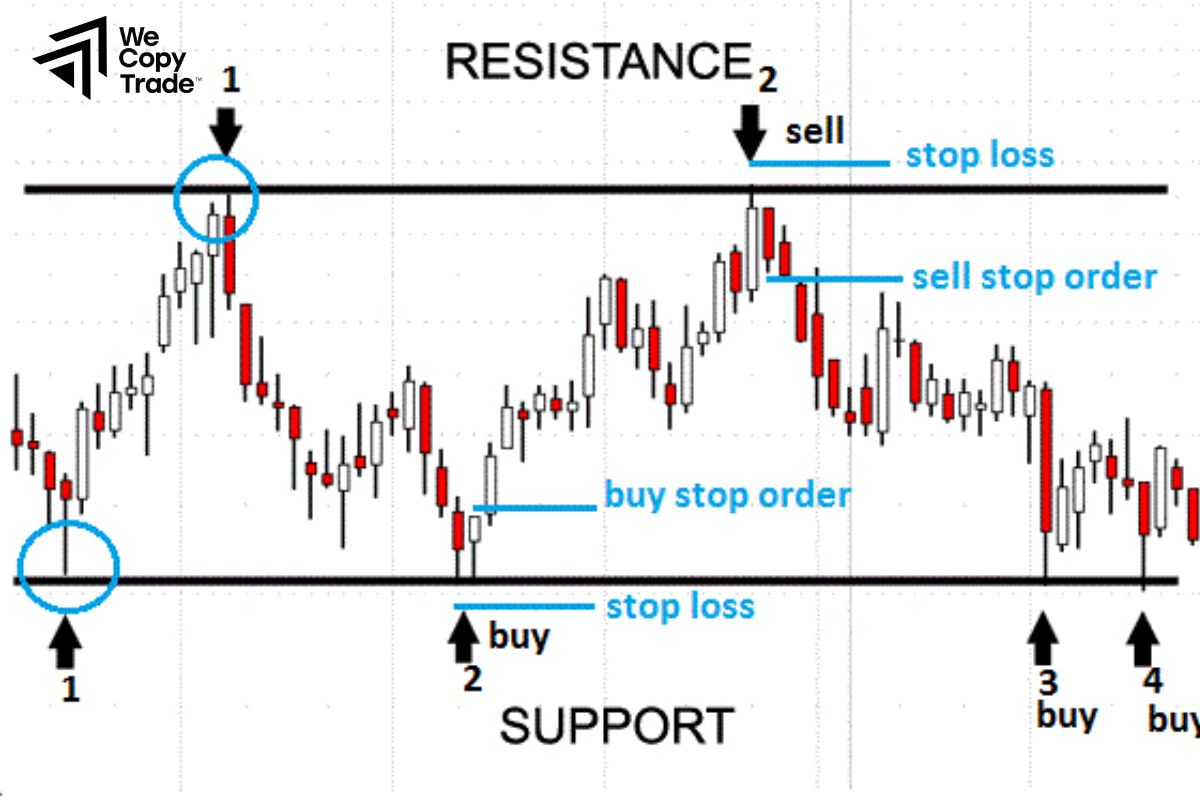
- Place a stop-loss order below the upward-sloping support line to limit potential losses if the breakout fails.
- Alternatively, you could set it just below the last swing low for more conservative risk management.
Establish Price Targets
- Calculate the potential price target by measuring the height of the triangle (from the highest resistance to the lowest support) and adding that distance to the breakout point.
- This helps in setting realistic profit-taking levels.
Monitor Price Action
- After entering the trade, monitor the price action closely. Look for signs of continuation or reversal.
- If the price approaches the target but shows weakness, consider taking partial profits or adjusting your stop-loss to secure gains.
Adjust for Market Conditions
- Be aware of broader market trends and news that could impact price movements.
- Use additional technical indicators (like RSI or MACD) to confirm momentum before entering or exiting trades.
Advantages and Disadvantages of Trading an Ascending Triangle
Advantages of Trading an Ascending Triangle
- The pattern provides well-defined levels for entering and exiting trades, making it easier for traders to plan their strategies.
- Ascending Triangle are generally considered bullish patterns, signaling potential upward price movements, which can lead to profitable trades.
- Traders can set stop-loss orders below the upward-sloping support line, allowing for a manageable risk-to-reward ratio.
- Increased volume during the breakout provides additional confirmation of the pattern, reducing the likelihood of false signals.
- The Ascending Triangle can be applied across various asset classes, including stocks, forex, and cryptocurrencies, making it a versatile tool for traders.
Disadvantages of Trading an Ascending Triangle
- One of the main risks is the potential for false breakouts, where the price briefly surpasses the resistance level but quickly reverses, leading to losses.
- The formation of an Ascending Triangle can take time, requiring patience from traders who may prefer quicker setups.
- Broader market trends or economic news can disrupt the pattern, leading to unexpected price movements that may invalidate the trade.
- The effectiveness of the pattern relies on technical analysis, which may not always accurately predict future price movements.
- The target for profit may be capped based on the height of the triangle, which can limit the overall profit potential compared to other trading strategies.
What is the Difference Between an Ascending Triangle and a Descending Triangle
Here’s a comparison table outlining the key differences between an Ascending Triangle and a Descending Triangle:
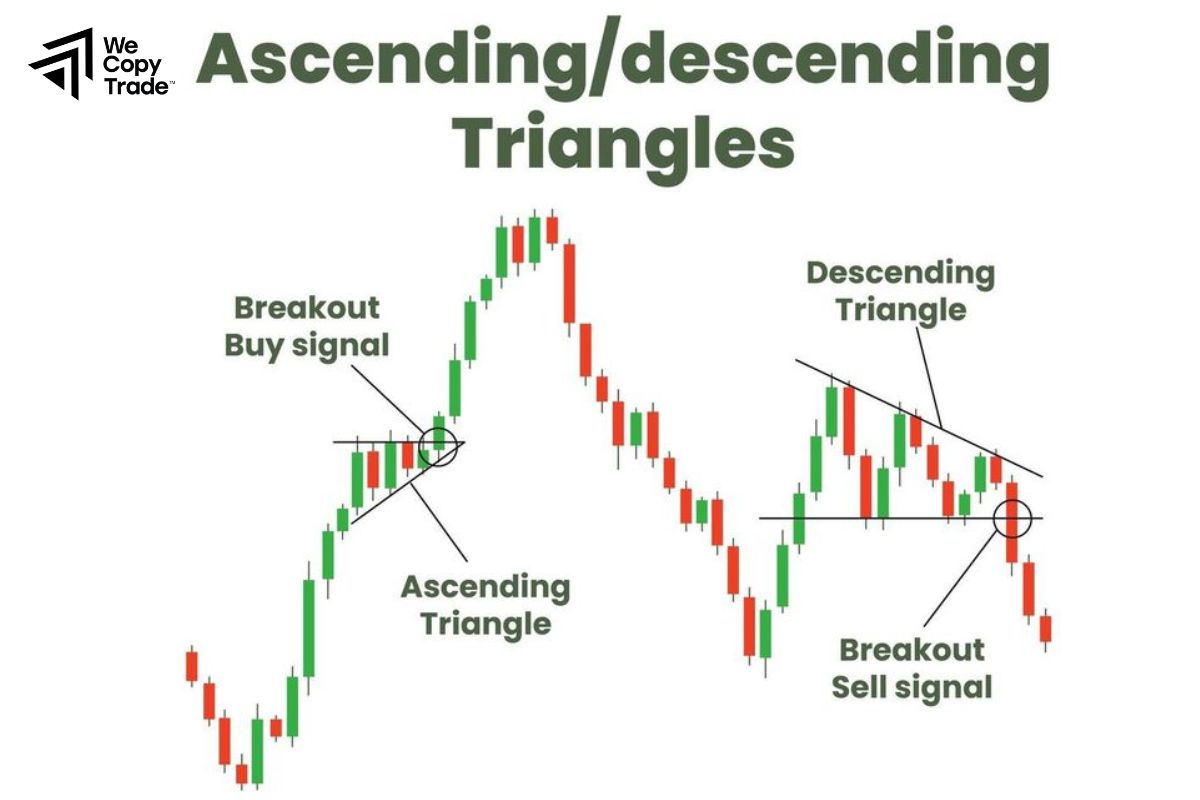
| Feature | Ascending Triangle | Descending Triangle |
| Structure | Horizontal resistance line; upward-sloping support line | Horizontal support line; downward-sloping resistance line |
| Market Sentiment | Bullish (indicates increasing buying pressure) | Bearish (indicates increasing selling pressure) |
| Price Action | Higher lows leading to a potential breakout above resistance | Lower highs leading to a potential breakdown below support |
| Trading Implications | Long positions on breakout above resistance | Short positions on breakdown below support |
| Price Target Calculation | Height of the triangle projected upward from the breakout point | Height of the triangle projected downward from the breakdown point |
| Market Context | Forms in bullish markets or uptrends | Forms in bearish markets or downtrends |
Notes When Trading an Ascending Triangle
Here are some quick and clear tips when trading the Ascending Triangle:
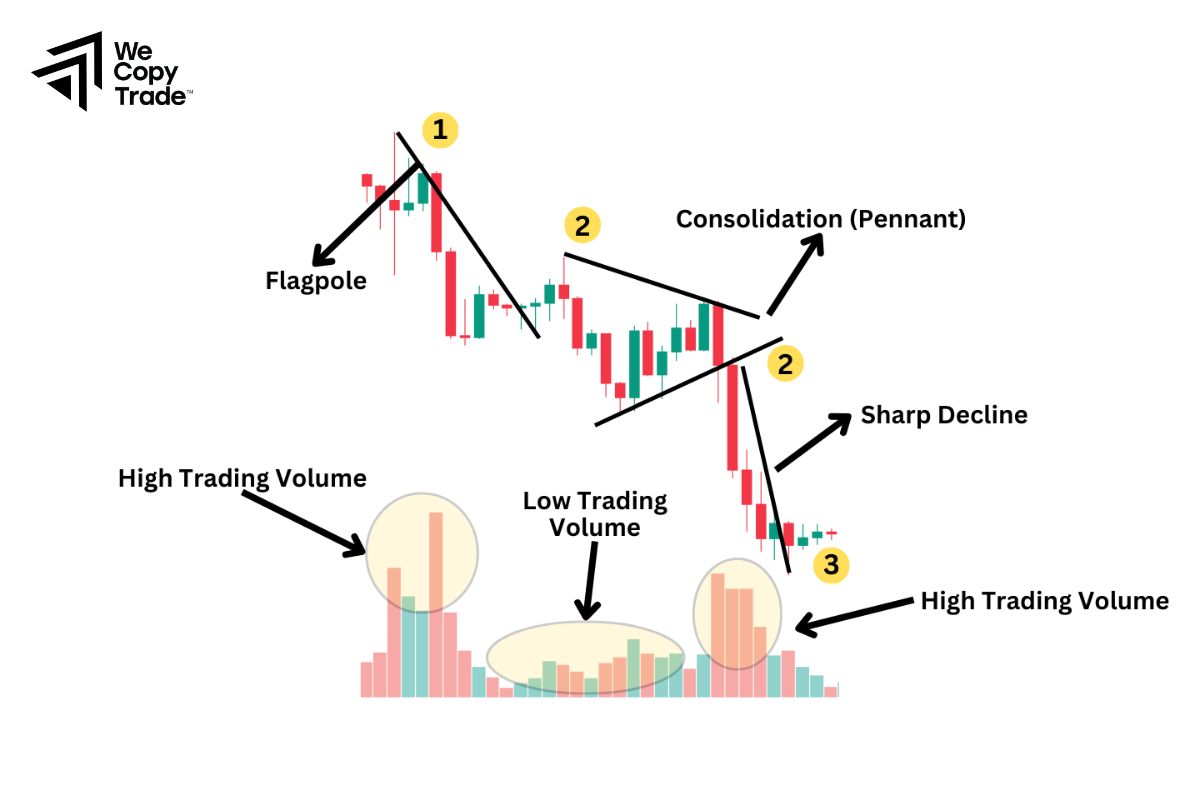
- Make sure there is a clear horizontal resistance line and an upward sloping support line.
- Watch volume; it usually decreases during consolidation.
- Open a long position when price breaks above resistance, preferably with increasing volume.
- Use a buy stop just above resistance to ensure entry after the breakout.
- Place a stop loss below the upward sloping support line or, place a stop loss below the most recent swing low for tighter risk control.
- Fibonacci levels can be used for additional hints.
- Watch price action for signs of continuation or weakness.
- If price is close to the target and shows signs of reversal, consider protecting profits.
- Do not risk more than 1-2% of capital per trade.
- Adjust position size according to risk tolerance and stop loss distance.
Conclusion
In conclusion, the Ascending Triangle pattern serves as a valuable tool for traders looking to capitalize on bullish market trends. Remember to stay vigilant for volume confirmation and broader market conditions that may impact your trades. If you’re ready to take your trading to the next level, consider incorporating the Ascending Triangle into your strategy today and watch how it can help you identify profitable opportunities in the market!
See more:





