












Have you ever heard or seen similar shapes like flags appearing on price charts? In technical analysis, this pattern is extremely popular and useful. I believe that after this article, you will be blaming yourself for not knowing about them earlier. Let’s learn about flag patterns and add them to your market psychology guide today!
What is Flag Pattern?
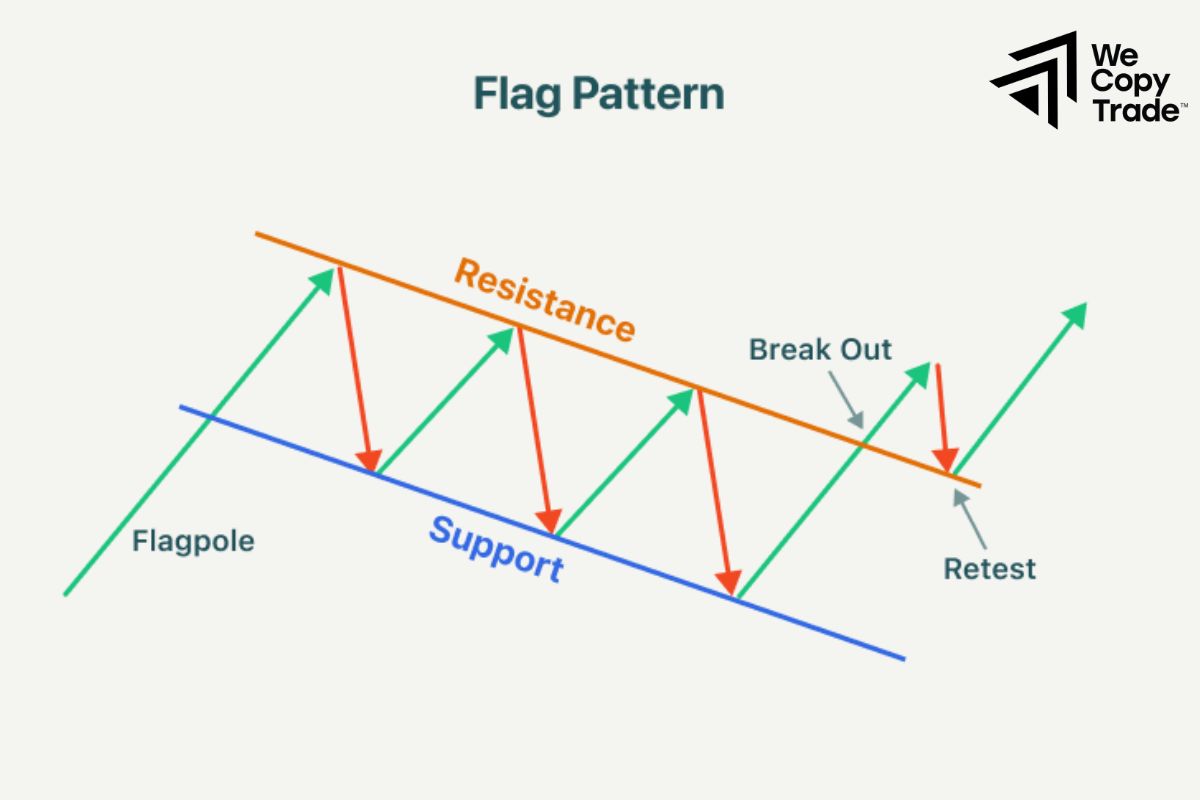
A flag pattern is a characteristic chart pattern that indicates a continuation of a trend in the market. Consists of 2 main parts: the flagpole (the first stage, when the price moves strongly in a certain direction (up or down) and the flag (the price moves in a narrow channel, opposite to the flagpole, forming a shape like a flag ). With such a characteristic shape, the flag patterns is very easy to recognize and analyze on the chart.
When the Flag pattern appears, it often signals that the current trend (up or down) will continue after a short-term adjustment period. From there, it helps investors identify potential entry points when the price breaks out of the flag’s price channel.
When the price moves strongly in a certain up or down direction, forming a main trend called the flagpole Next, in the adjustment period, the price moves in a narrow channel, forming a flag. And finally, the breakout signal, when the price breaks out of the flag’s price channel in the direction of the flagpole, the main trend is forecast to continue.
See more:
- Top Common Types Of Chart Patterns Trading For Beginners
- Best Popular Types of Reversal Patterns Candlestick
- Symmetrical Triangle Patterns in Trading You Should Know
- What are Continuation Patterns? Common Types of Patterns
How does it work?
- Once we have identified the flag pattern, we can make more informed and accurate trading decisions.
- By identifying appropriate entry points and placing stop-loss orders, we can better control our risks.
- The flag pattern helps us take advantage of profitable opportunities when the market is in a clear trend.
Why is Flag Pattern important in Technical Analysis?
Once we have identified the flag patterns, we can easily predict the next trend in the market and make appropriate decisions. By analyzing the flag pattern, we can better understand investor psychology and the factors that affect prices.

Bullish Flag Pattern
- A bullish flag pattern is a special chart pattern used by technical traders to identify the continuation of an uptrend. The shape of this pattern is quite similar to a flag flying on a flagpole, with the flagpole representing the initial strong price increase and the flagpole representing the short-term correction phase, with prices moving in a narrow channel, parallel to the flagpole, often slanting slightly upwards.
- In the initial phase, the price of a stock or asset increases rapidly due to strong buying demand. Then, during the correction phase, the price may correct slightly downward within a narrow range, forming a flag-like shape. Finally, when the price breaks out of the correction range and continues to rise, it is a breakout signal that the initial uptrend will continue.
Bearish flag pattern

- The bearish flag pattern is a useful technical analysis tool for predicting the continuation of a downtrend. It is quite similar in structure to the bullish flag pattern, but in reverse. Instead of signaling a rise in prices, the bearish flag pattern indicates a high probability that prices will continue to fall.
- In the initial stage, the price of a stock or asset falls sharply due to strong selling pressure. After the sharp decline, the price may correct slightly higher within a narrow range, forming a shape similar to a flag, but tilted downward. When the price breaks out of the correction range and continues to fall, it is a signal that the initial downtrend will continue.
How To Identify Flag Pattern
To identify a valid bearish flag pattern, you need to pay attention to the following factors:
- A sharp initial decline: Prices fall continuously with new lows.
- A correction phase within a narrow price channel: Prices move within a narrow price range, forming a shape resembling a downward-sloping flag.
- Trading volume: Trading volume usually decreases during the correction phase and increases again when prices break out.
Risk Management When Trading Flag Patterns
In addition to its outstanding price prediction ability, the flag pattern also has some risks that need to be noted. Here are effective risk management plans that are summarized from the valuable experiences of successful investors:
Choose a reasonable position size
- Only invest a small portion of your trading account in each trade.
- The distance from the entry point to the stop loss will determine your position size.
- When the market is volatile, you may need to adjust the position size accordingly.
Stick to your trading plan

- Stick to your pre-established trading plan, avoid making decisions based on emotions.
- Do not enter into trades that are unclear or do not fit your strategy.
Be flexible to market changes
- Stay updated with information about events and news that may affect the market.
- If the market is volatile, be prepared to adjust your stop loss to protect your capital.
Diversify your portfolio
- Invest in a variety of assets to spread your risk.
- If one trade fails, other trades can make up for it.
Review and adjust regularly
- Regularly review your trades to learn from them.
- If necessary, adjust your trading strategy to suit current market conditions.
Conclusion
In conclusion, the bearish flag pattern is a useful technical analysis tool that helps investors identify timely buying and selling opportunities. However, no tool is perfect, so it is necessary to combine the bearish flag pattern with other analysis to make the right investment decisions.
See now:





