












To become a successful trader, you first need to understand how the market works, as well as price fluctuations. A very useful suggestion for you is the candlestick pattern. Let’s quickly learn these patterns to confidently master the trading playground right after this!
What is a candlestick pattern?
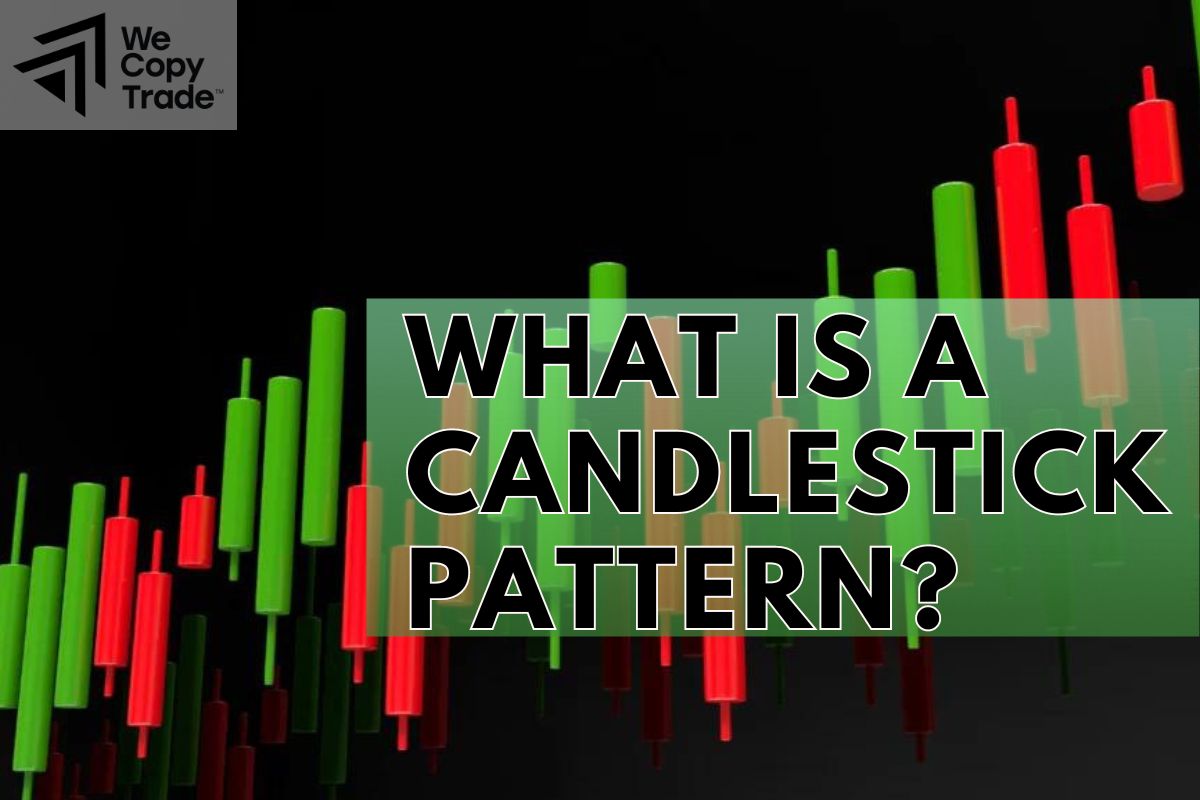
Candlestick pattern are one of the most popular charts for Japanese traders from the 18th century to the present, often used to predict price changes. Instead of simply displaying the open, high, low, and close prices like other types of charts, candlestick charts also show us more clearly the battle between buyers and sellers in each trading session.
There is many different candlestick pattern, each pattern has its own meaning. If the candle is green (or white), it means that the buyers have dominated. On the contrary, if the candle is red (or black), the sellers have won.
All candlestick patterns you should know
Each candlestick has its own way of forming and reflecting different meanings. Here are the most common patterns that appear in the market:
Bullish candlestick pattern:
Hammer
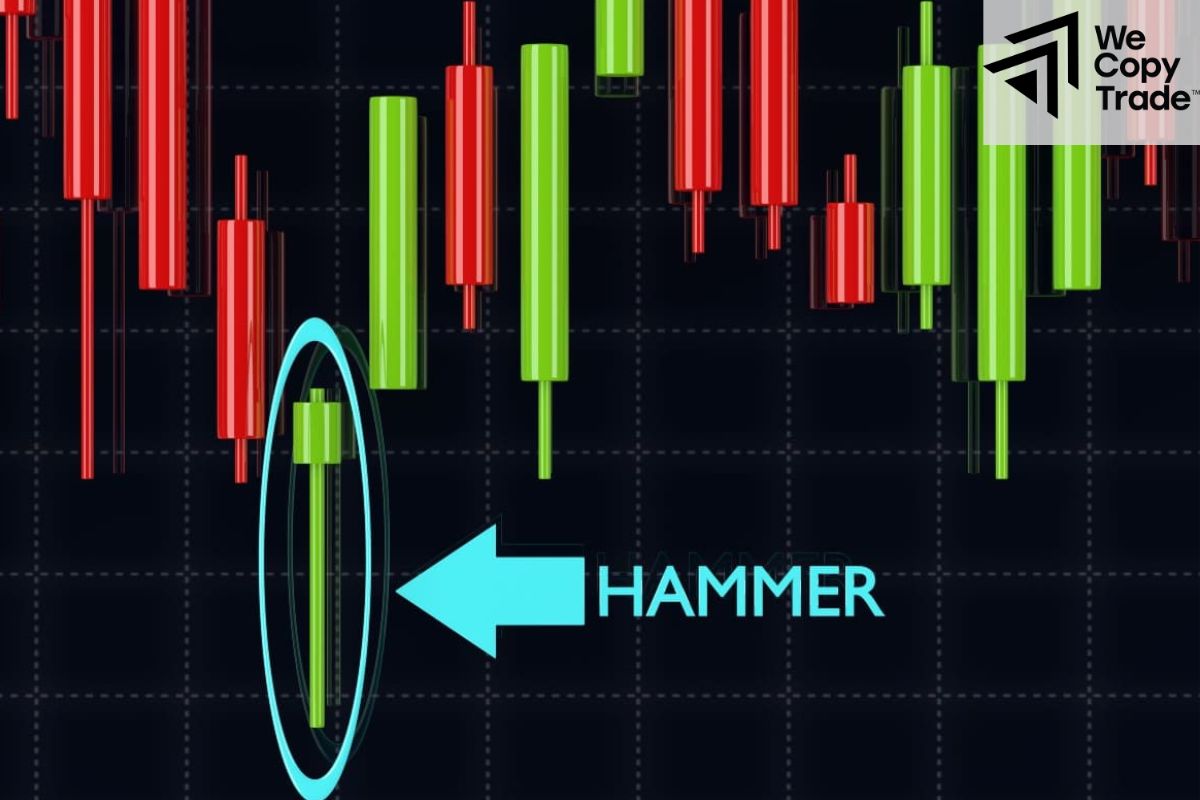
This pattern forms to represent a battle between buyers and sellers. And the outcome is in favor of the buyers with prices being pushed higher despite the pressure of sellers pushing prices down.
Inverted hammer
Similar to the hammer, the inverted hammer also shows the power of buyers. However, instead of being crushed at the beginning of the session, buyers tried to push prices up from the beginning and succeeded in keeping prices high.
Bullish engulfing
This pattern is like a battle where buyers completely overwhelm sellers. After a negative trading day, buyers come back strongly and swallow the previous red candle, indicating a complete change in market dynamics.
Piercing line
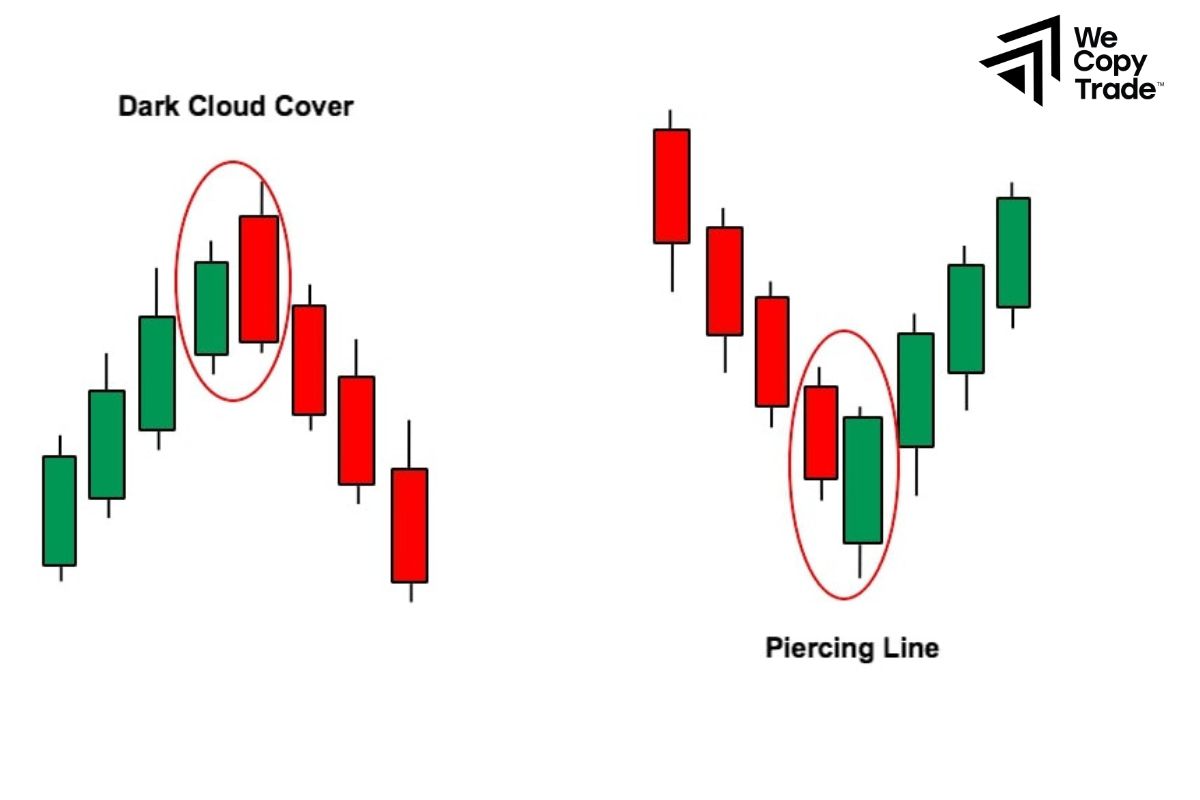
When a piercing line pattern appears, you can imagine that the sellers tried their best to push the price down, but the next day, the buyers came back strongly and “pierced” through the sellers’ defenses, pushing the price higher.
This pattern is similar to an army breaking through the opponent’s defenses.
Morning Star
The morning star pattern is like a ray of hope appearing after a period of gloomy market. After a negative trading day, the market has a sideways trading day, showing that the selling pressure has eased. And on the third day, the buyers regained control and pushed the price higher.
You can compare the morning star pattern to a bright star appearing in the night sky after a rainstorm.
Three White Soldiers
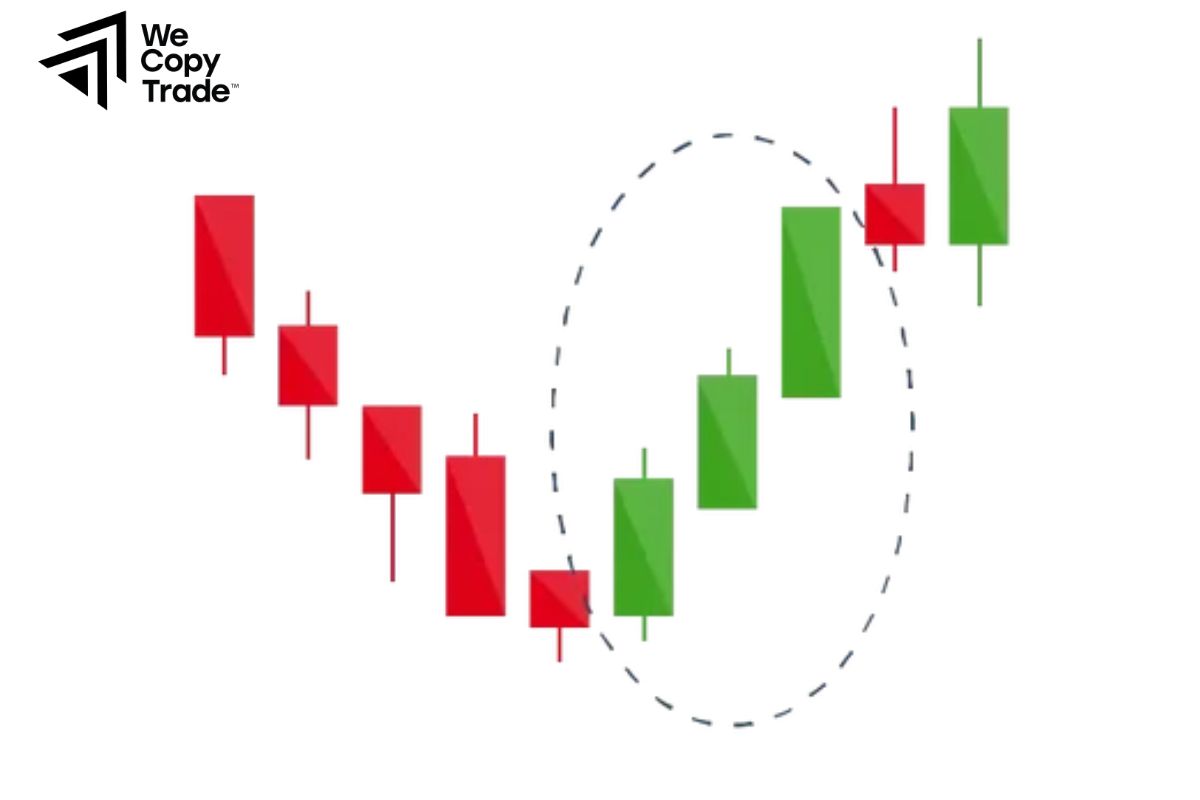
This pattern shows a strong change in investor sentiment. After a period of selling, investors start to feel more optimistic and continuously buy, creating a sustainable uptrend.
Bearish Candlestick Patterns:
Hanging Man
When a hanging man pattern appears, you can visualize it as a person trying to hold onto a cliff but eventually falls off. At this point, buyers tried their best to keep the price high, but were eventually pulled down by sellers. This is a sign that the buyer’s strength is waning.
Shooting Star
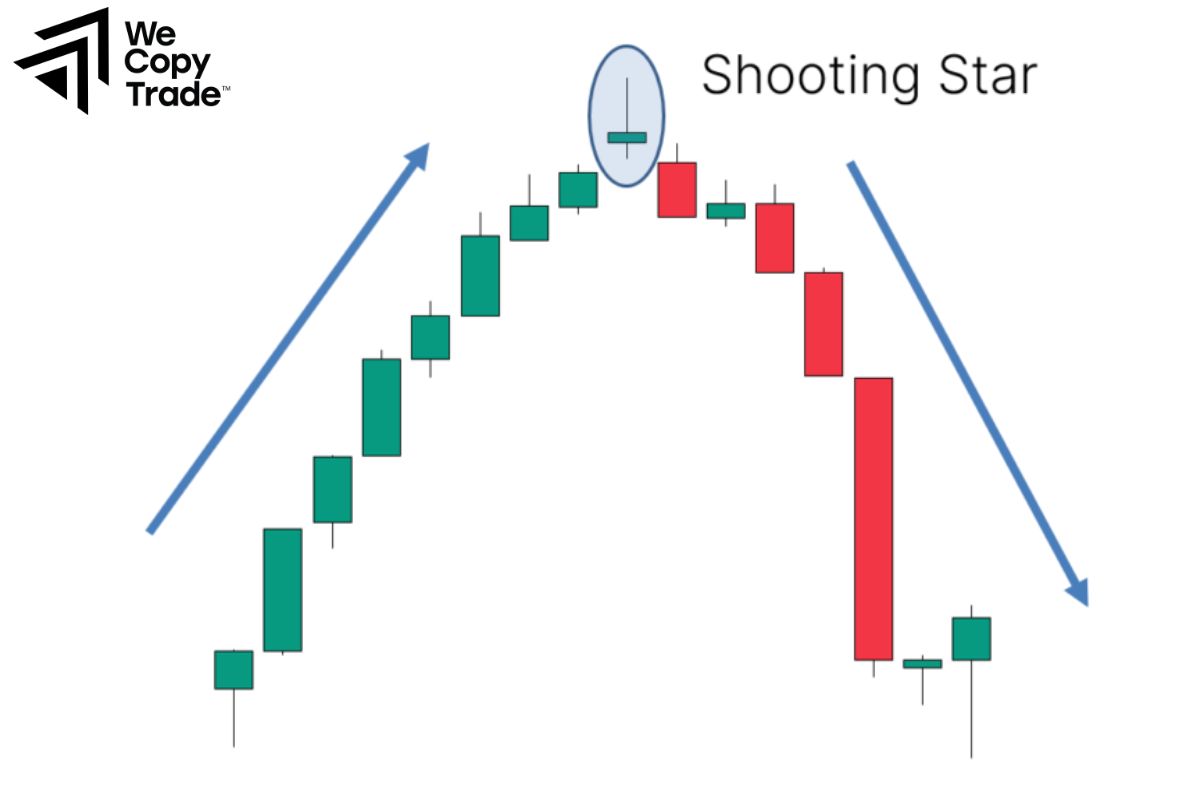
The shooting star pattern resembles a shooting star streaking across the sky. After a period of price increase, the price suddenly drops and forms a long upper tail. This shows that sellers have gained the upper hand and are pushing the price down.
Bearish Engulfing
This pattern resembles a hammer hitting and destroying a building. After a period of price increase, the price suddenly drops sharply and “swallows” the previous bullish candle. This shows that the uptrend has been reversed and the market is moving into a bearish phase.
Evening Star
This pattern appears like a shooting star streaking across the night sky, signaling that something unfortunate is about to happen. The market has a long green candlestick, then red candles appear, signaling that the next development is not good. The final result shows that the uptrend has ended and the market is moving into a bearish phase.
Three Black Crows
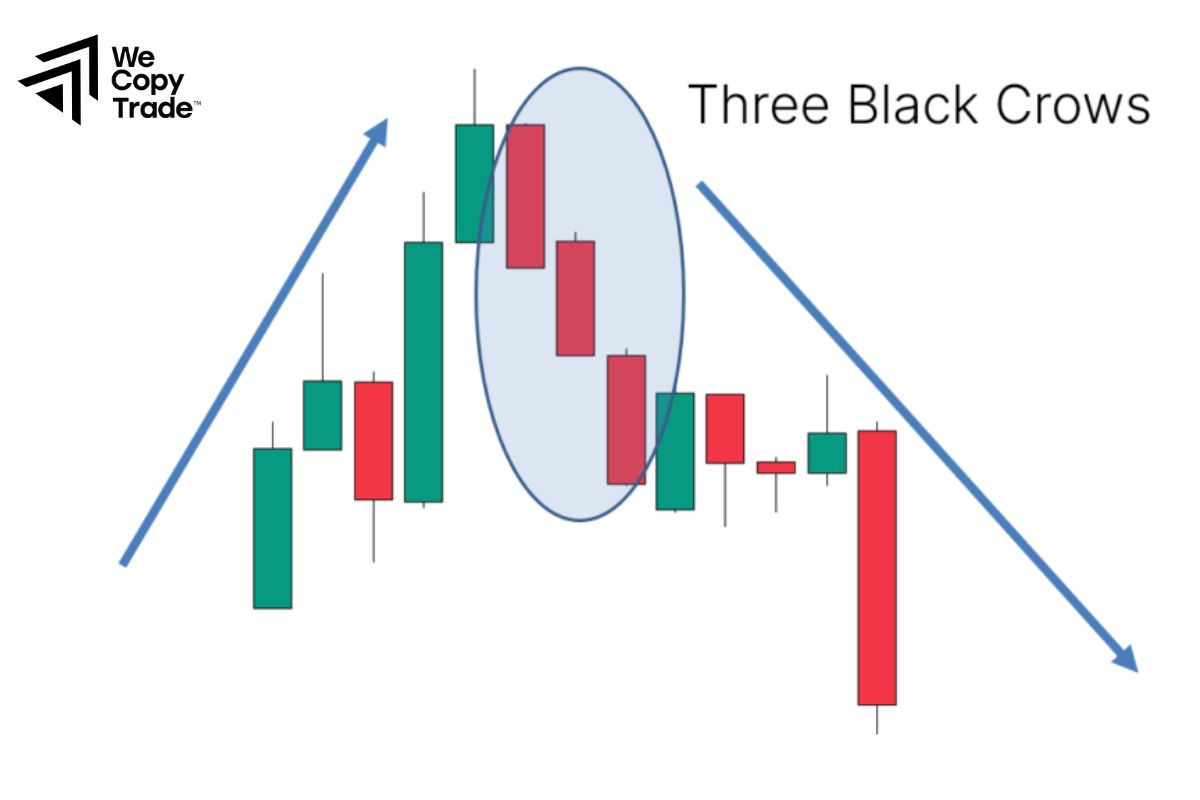
This pattern resembles three black crows flying across the sky, signaling that a storm is coming. Each red candle is a sign that sellers are getting stronger and are pushing prices down.
Dark Cloud Cover
This pattern is like a dark cloud covering the sun, blocking out the light of hope. After a positive trading day, a red candle appears and completely covers most of the previous green candlesticks, indicating that the uptrend has ended and the market is moving into a bearish phase.
Important of candlestick Pattern in trading
Candlestick Patterns have become an indispensable tool in modern trading. The visual appearance of candlestick charts allows traders to easily recognize price movements and market sentiment. For example, a long green candle appearing after a series of red candles can signal a potential reversal from a downtrend to an uptrend.
Candlestick patterns such as “Hammer”, “Three Black Crows” or “Evening Star” help traders predict entry points and place orders effectively. Moreover, candlestick charts can also be combined with other technical analysis tools such as trend lines, moving averages and technical indicators to confirm trading signals.
Versatility is a great advantage of Japanese candlestick charts. They can be applied to many different types of markets, from stocks, forex to commodities and indices. As a result, traders can use a unified tool to analyze and trade across a variety of assets.
How to Read a Candlestick Pattern
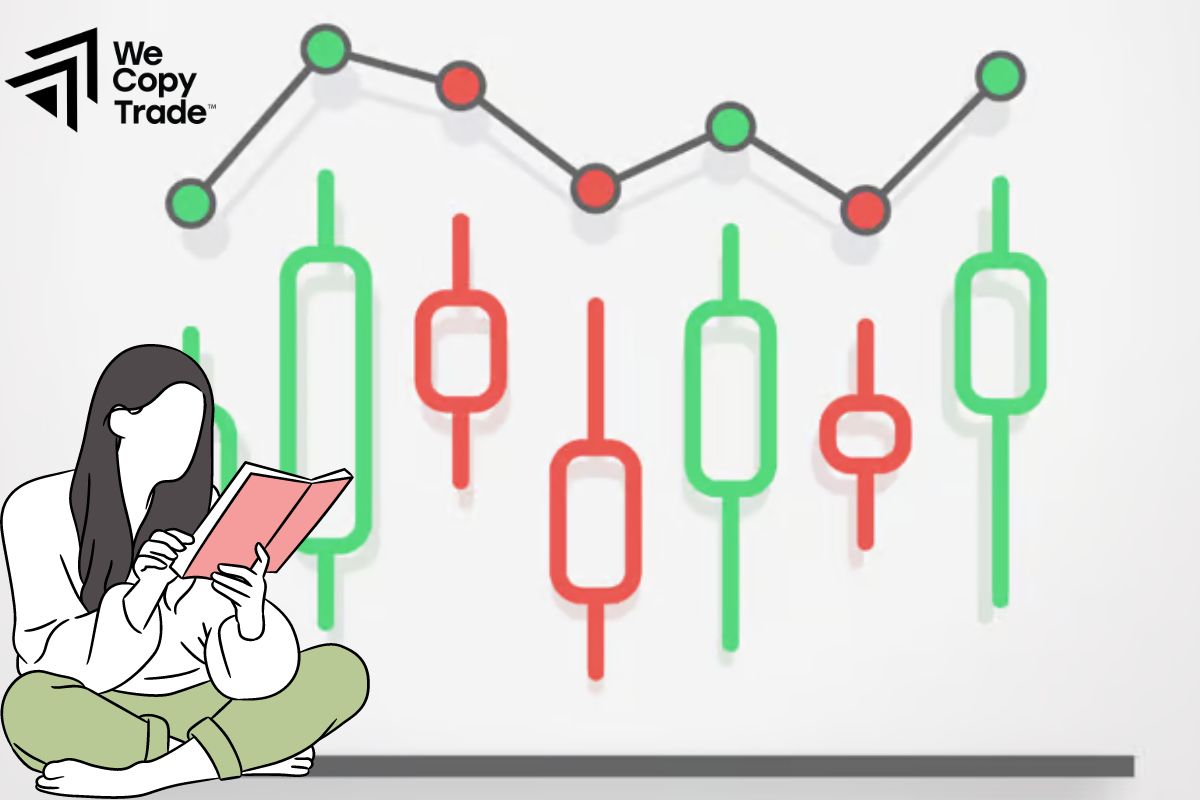
One of the most important factors in investing is knowing how to identify and predict trends. So how do we “read” the stories that candlestick charts are telling? Here are some simple but comprehensive steps:
- Look at the chart as a whole to see if the price is going up, down or sideways
- Zoom in and analyze the chart in detail, find the peaks and troughs to determine the trend line.
- Based on the information collected in the two steps above, make predictions and assessments about future trends.
Highs and Lows, Peaks and Valleys
As the transaction takes place, you will see highs and lows. They are the “footprints” that the market leaves behind, helping us better understand its trend.
To identify an uptrend, look at the peaks and troughs. If each peak is higher than the previous peak and each trough is higher than the previous trough, then it is a healthy uptrend. Conversely, if the peaks and troughs are getting lower, it is a downtrend.
Educated Guessing Method

Based on what we have observed from the chart, to better understand this pattern, we need to have our own hypothesis.
See the peaks and troughs on the chart as milestones on a road. We will measure the distance between these milestones to see if the road is going up, down or sideways.
The candlesticks on the chart are like little stories, they reveal the psychology of investors. For example, a candle with a long lower shadow shows that buyers have tried to push the price down but failed, which shows that the buying force is very strong.
Conclusion
In conclusion, candlestick pattern is very popular and useful, right? Understand the rules of formation and apply them carefully before making trading decisions, future successful traders!
See now:





