












In financial markets, the ability to accurately predict market direction is paramount for traders seeking consistent profitability. While trend reversals often grab headlines, the more subtle yet equally crucial aspect of trend persistence, known as continuation candlestick patterns, offers significant opportunities. These patterns, formed by the collective psychology of market participants, provide visual cues that an existing price trend is likely to extend rather than reverse.
Understanding these specific formations allows traders to confidently enter or hold positions, aligning their strategies with the prevailing market sentiment. They represent periods of consolidation or brief retracement within an established trend, often preceding a renewed push in the original direction. For those engaged in prop trading or navigating the dynamic forex markets, identifying these signals can be a critical edge.
This article will explore the core concepts behind continuation candlestick patterns, detail their key characteristics, and explain some of the most reliable formations. We will also discuss how to confirm these signals using volume and other technical indicators, and ultimately, how to integrate them into a robust trading strategy to enhance decision-making and capitalize on ongoing market momentum.

Understanding Continuation Candlestick Patterns in Technical Analysis
In the realm of technical analysis, traders meticulously study historical price data to forecast future market movements. Among the myriad tools available, Japanese candlesticks stand out for their ability to encapsulate price action—open, high, low, and close—within a single, easily digestible visual representation. While many focus on reversal patterns that signal a change in trend, continuation candlestick patterns provide equally vital information: the likelihood of an existing trend persisting. These patterns are essential for confirming market trends and maintaining alignment with the dominant price direction.
Continuation patterns emerge during a temporary pause or minor retracement within a larger uptrend or downtrend. They signify that the market is merely taking a breather before resuming its prior trajectory, rather than preparing for a full reversal. Recognizing these formations is critical for maintaining profitable positions or initiating new ones in the direction of the established trend. Mastery of these patterns is a cornerstone of effective market interpretation. For those looking to deepen their expertise, exploring comprehensive trading academy resources can provide invaluable insights into advanced chart analysis.
These patterns are distinct from reversal patterns, which indicate an impending shift in market sentiment and direction. Instead, continuation patterns reinforce the current market bias, suggesting that the underlying forces driving the trend remain dominant. For instance, in a strong uptrend, a continuation pattern might appear as a brief period of sideways movement or a minor dip, followed by the resumption of upward momentum. Conversely, in a downtrend, a similar consolidation would likely precede further declines. This makes them indispensable tools for identifying candlestick patterns for trend continuation and refining technical analysis continuation patterns within any financial market. They offer a tangible way to interpret price action continuation, allowing traders to make more informed decisions by understanding when the market is merely consolidating rather than reversing.
Key Characteristics and Identification of Continuation Patterns
Identifying candlestick continuation patterns requires a keen eye for detail and an understanding of their fundamental characteristics. Unlike reversal patterns, which often feature distinct long bodies and shadows at trend extremes, continuation patterns typically appear within an established trend and show signs of temporary indecision or consolidation. The primary characteristic is their occurrence mid-trend, following a significant price move, and preceding a further move in the same direction.
One key aspect is the context in which they form. A continuation pattern is only valid if it appears within a clear market trend—either an uptrend or a downtrend. Without an existing trend, these patterns lose their predictive power, as there is no trend to “continue.” Traders often look for smaller candle bodies within these patterns, indicating a temporary balance between buyers and sellers, or a period of profit-taking before the trend resumes. This temporary pause or retracement is crucial for how to identify continuation patterns effectively.
Another characteristic involves the relationship between the pattern’s candles and the preceding trend. For bullish continuation candlestick patterns, subsequent candles typically consolidate above a key support level or show signs of buyers regaining control after a minor pullback. For bearish continuation candlestick patterns, price action might consolidate below resistance or show sellers reasserting dominance after a brief bounce. Understanding these nuances helps differentiate between true trend continuation signals and potential reversals. While there are similarities in the interpretation of reversal and continuation candlestick patterns, the context of their appearance—at the end of a trend versus within a trend—is the defining factor. Developing expertise in these distinctions is vital for constructing robust master trading strategies. The ability to accurately interpret understanding continuation patterns separates skilled traders from those who misinterpret market signals.

Common and Reliable Continuation Candlestick Patterns Explained
Several continuation candlestick patterns are recognized for their reliability in signaling the persistence of an existing trend. Mastering these formations is crucial for anyone engaging in chart analysis continuation. These patterns provide visual cues that help traders anticipate the next move in financial markets.
Rising Three Methods (Bullish)
The rising three methods is a powerful bullish continuation pattern. It occurs within an uptrend and consists of a long bullish candle, followed by three smaller bearish candles that trade within the range of the first bullish candle. Finally, a fifth long bullish candle closes above the high of the first candle, signaling that the uptrend is set to continue. This pattern shows a temporary pause and minor profit-taking, but buyers ultimately regain control.
Falling Three Methods (Bearish)
Conversely, the falling three methods is a bearish continuation pattern found in downtrends. It starts with a long bearish candle, followed by three smaller bullish candles that trade within the range of the first bearish candle. The pattern concludes with a fifth long bearish candle that closes below the low of the first candle, indicating the downtrend will likely resume. This signifies a brief attempt by buyers to push prices higher, ultimately overwhelmed by sellers.
Tasuki Gap Pattern (Bullish and Bearish)
The tasuki gap pattern can be bullish or bearish. A bullish Tasuki Gap occurs in an uptrend with two bullish candles gapping up, followed by a bearish candle that opens within the second bullish candle and closes within the first, but does not close the gap. This suggests the uptrend will continue. A bearish Tasuki Gap is its inverse, appearing in a downtrend with two bearish candles gapping down, followed by a bullish candle that opens within the second bearish candle and closes within the first, without filling the gap. This pattern confirms the ongoing downtrend. Traders often leverage these insights when they how to trade indices.
Mat Hold Pattern (Bullish and Bearish)
The mat hold pattern is another reliable continuation pattern. A bullish Mat Hold begins with a large bullish candle, followed by a gap up and three smaller candles (often bearish, but staying above the first candle’s open), and then a final large bullish candle that closes above the previous high. A bearish Mat Hold is the opposite: a large bearish candle, a gap down, three smaller candles (often bullish, but staying below the first candle’s open), and then a final large bearish candle that closes below the previous low. These are considered some of the most reliable continuation patterns due to their clear structure.
On-Neck, In-Neck, and Thrusting Line Patterns (Bearish)
These three patterns are variations of bearish continuation signals. The on neck line pattern features a long bearish candle followed by a small bullish candle whose close is near the low of the first candle. The in neck line pattern is similar, but the bullish candle’s close is slightly higher, at or slightly above the first candle’s low. The thrusting line pattern sees the bullish candle close penetrating further into the body of the first bearish candle, but still below its midpoint. All three indicate that despite a brief bounce, the underlying bearish momentum is likely to continue.
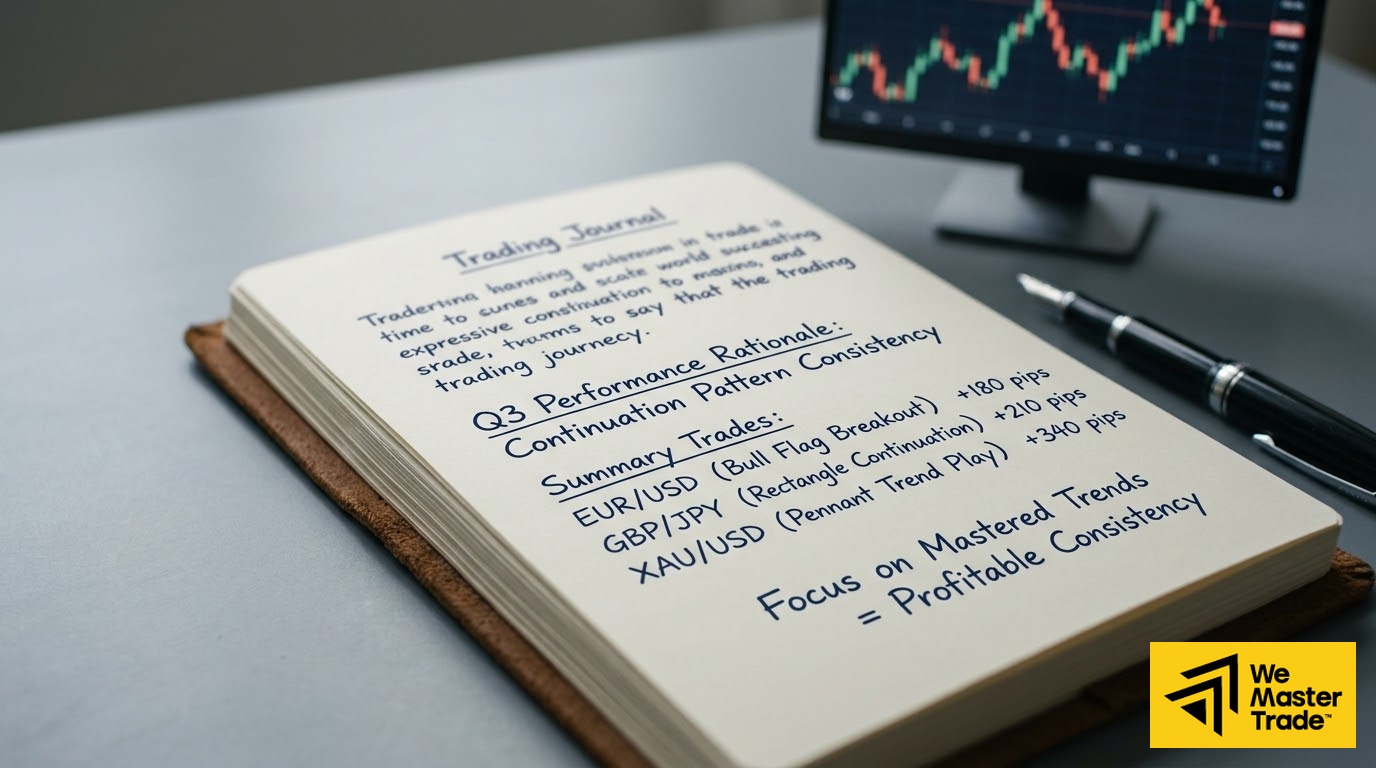
Confirming Continuation Signals with Volume and Other Indicators
While candlestick patterns provide powerful visual cues, their reliability is significantly enhanced when confirmed by other technical analysis tools, particularly volume in continuation patterns and additional indicators. This layered approach helps filter out false signals and strengthens the conviction behind a trading decision. The principle is simple: strong trends are typically accompanied by strong volume.
When a continuation pattern forms, traders look for specific volume characteristics. For bullish continuation patterns, a decrease in volume during the consolidation phase, followed by a surge in volume as the trend resumes, acts as a strong confirmation. This suggests that the temporary pause was indeed a period of profit-taking or indecision, not a reversal, and that new buying interest is driving the price higher. Conversely, for bearish continuation patterns, a similar pattern of declining volume during the brief upward correction, followed by an increase in volume as the downtrend continues, validates the pattern. This confirmation of continuation patterns through volume analysis is a critical step in effective trading.
Beyond volume, other technical indicators can provide additional confluence. Moving Averages, such as the 50-period or 200-period Simple Moving Average (SMA), can confirm the underlying trend direction. If a bullish continuation pattern forms above a rising moving average, it reinforces the bullish bias. Oscillators like the Relative Strength Index (RSI) or the Moving Average Convergence Divergence (MACD) can also be used. For instance, if an RSI reading remains above 50 during a bullish continuation pattern’s consolidation, it suggests underlying strength. Similarly, a MACD histogram staying above the zero line during a bullish pause would offer further confirmation. Integrating these tools helps traders execute instant trades with greater confidence, knowing their chart analysis continuation is backed by multiple data points. WeMasterTrade’s robust platforms allow for seamless integration of these indicators for real-time analysis.
Integrating Continuation Patterns into Your Trading Strategy
Integrating continuation candlestick patterns into a comprehensive trading strategy involves more than just identifying the patterns; it requires understanding entry and exit points, risk management, and overall market context. These patterns serve as powerful signals for trend continuation, allowing traders to capitalize on established momentum.
For trading continuation patterns, the primary goal is to enter or add to a position in the direction of the trend after the pattern completes. For bullish patterns like the Rising Three Methods, an entry might be considered after the final bullish candle closes above the high of the first candle, confirming the resumption of the uptrend. Stop-loss orders are typically placed below the low of the consolidation phase, or below a significant support level, to protect against unexpected reversals. For bearish patterns, entry would be after the final bearish candle closes below the low of the first, with stop-losses placed above the consolidation’s high or a key resistance level.
Effective candlestick trading strategies often combine these patterns with broader market trends and fundamental analysis. For instance, a bullish continuation pattern in a stock that has recently released positive earnings, or a forex continuation patterns aligning with a favorable economic data release, provides a higher probability setup. Similarly, stock continuation patterns observed in sectors showing strong overall performance can be more reliable. It’s also crucial to consider the timeframe: continuation patterns on daily charts typically carry more weight than those on shorter intraday charts, though they are valuable across all timeframes.
Risk management remains paramount. Even the best continuation patterns can fail, so position sizing and stop-loss placement are non-negotiable. Traders should also consider taking partial profits as the trend progresses, allowing them to maximize trading payouts while reducing exposure. Regularly reviewing candlestick pattern analysis in conjunction with a trade journal helps refine strategy over time, adapting to evolving market conditions. The ability to act decisively on these signals, combined with sound risk management, is what turns pattern recognition into profitable action.
Frequently Asked Questions About Candlestick Continuation Patterns
Q: What distinguishes continuation candlestick patterns from reversal patterns?
A: Continuation patterns signal that an existing trend is likely to persist after a brief pause, whereas reversal patterns suggest a trend is about to change direction entirely. The key difference lies in their position within the broader trend: continuation patterns appear mid-trend, while reversal patterns form at trend extremes.
Q: How do traders confirm the validity of a continuation pattern?
A: Traders confirm candlestick patterns continuation by observing supporting factors. This includes high trading volume coinciding with the breakout from the pattern, alignment with trend lines, and confirmation from other technical indicators such as Moving Averages, RSI, or MACD, which reinforce the underlying trend’s strength.
Q: What are some of the most common continuation candlestick patterns?
A: Some of the most common and reliable continuation candlestick patterns include the Rising Three Methods (bullish), Falling Three Methods (bearish), Tasuki Gap (bullish and bearish), Mat Hold (bullish and bearish), and the On-Neck, In-Neck, and Thrusting Line patterns (bearish).
Q: Can continuation patterns be used effectively in all market conditions?
A: While versatile, continuation patterns are most effective in clearly trending markets, whether uptrend or downtrend. Their reliability significantly decreases in sideways, range-bound, or highly volatile, choppy market conditions where a defined trend is absent, making signal interpretation difficult.
Q: How do volume and other indicators support continuation candlestick patterns?
A: High volume during the breakout phase of a continuation pattern often validates its strength, indicating strong conviction behind the renewed trend. Additionally, indicators like Moving Averages can confirm the prevailing trend direction, while oscillators such as RSI or MACD can provide additional confirmation of underlying momentum.
The WeMasterTrade Advantage: Capitalizing on Confirmed Trends
For skilled traders who adeptly identify continuation candlestick patterns and other robust trend signals, the challenge often lies not in analysis, but in having the capital and infrastructure to act swiftly and decisively. WeMasterTrade addresses this directly by providing instant funding, allowing traders to immediately capitalize on confirmed market movements without enduring lengthy evaluation periods. Our model ensures that when a clear continuation signal emerges, you have the capital at your fingertips to execute your strategy.
WeMasterTrade’s unique angel funding model differentiates us in the prop trading landscape. We provide instant funded trading accounts without evaluation, paired with a dedicated Risk Management team that copies high-probability trades at up to a 1:4 ratio alongside the trader’s positions. This symbiotic relationship means WeMasterTrade’s profitability directly depends on trader success, fostering an environment where shared success is the core objective, not just fees or commissions.
This structure allows traders to leverage their expertise in identifying candlestick patterns continuation and other technical insights with significantly enhanced capital. With a profit split of up to 90% in the trader’s favor, WeMasterTrade empowers you to maximize the returns from your precise trend-following strategies. Our platform is designed to support rapid execution and sophisticated chart analysis, ensuring you can fully exploit the opportunities presented by reliable trend continuation signals.
If you possess the analytical skill to spot and trade continuation candlestick patterns, WeMasterTrade offers the capital and support to elevate your trading results. Focus on what you do best – identifying high-probability setups – and let our innovative model amplify your impact in the market.





