












Looking to improve your trading strategy? Bullish Continuation Candlestick Patterns are essential for identifying ongoing upward trends in the market. These patterns signal strong buying pressure and can help you make more informed decisions. Start mastering these patterns today to boost your trading success!
What are Bullish Continuation Candlestick Patterns?
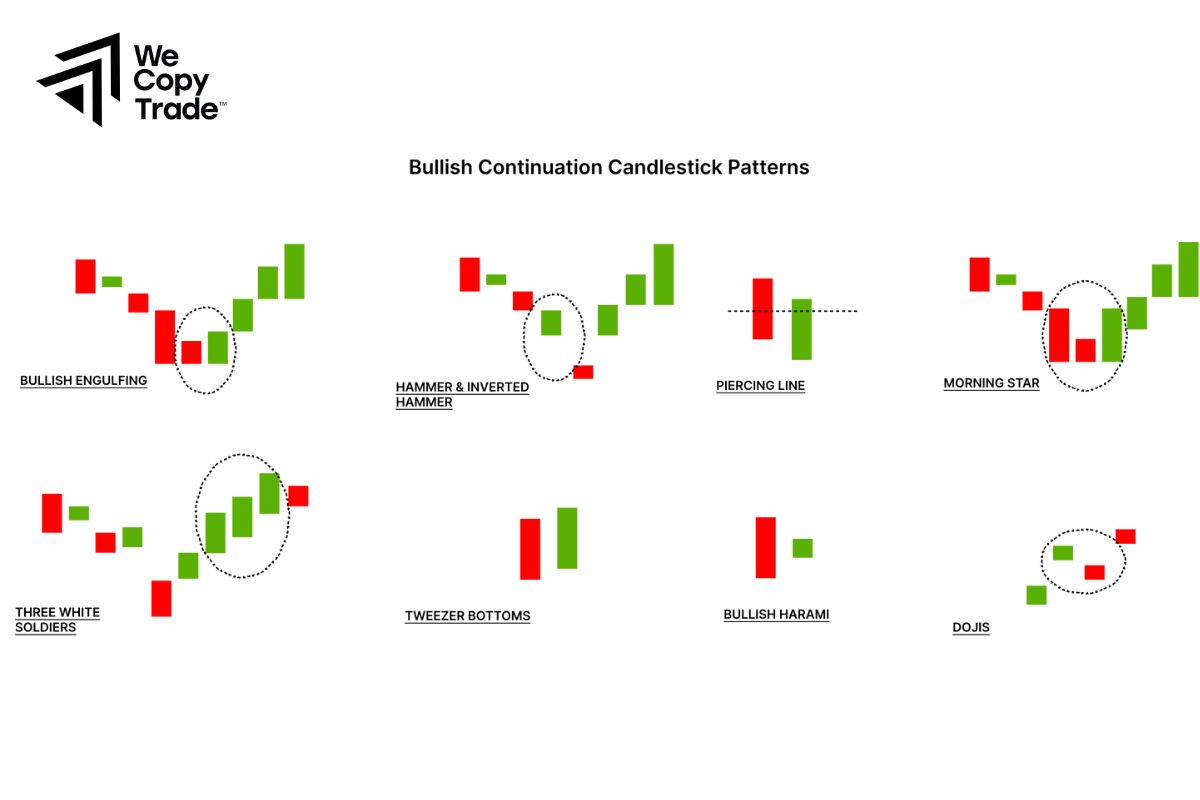
Bullish continuation candlestick patterns is a chart formation that occurs during an uptrend, signaling that the current upward momentum is likely to continue. These patterns indicate that buyers remain in control, and after a brief pause or consolidation, the price is expected to rise further.
However, common examples include patterns like the bullish flag, pennant, and ascending triangle, all of which suggest the continuation of the existing bullish trend. Traders often use these patterns to confirm entry points or stay in trades during upward market moves.
What are the important characteristics of bullish continuation candlestick patterns?
The important characteristics of bullish continuation candlestick patterns include:
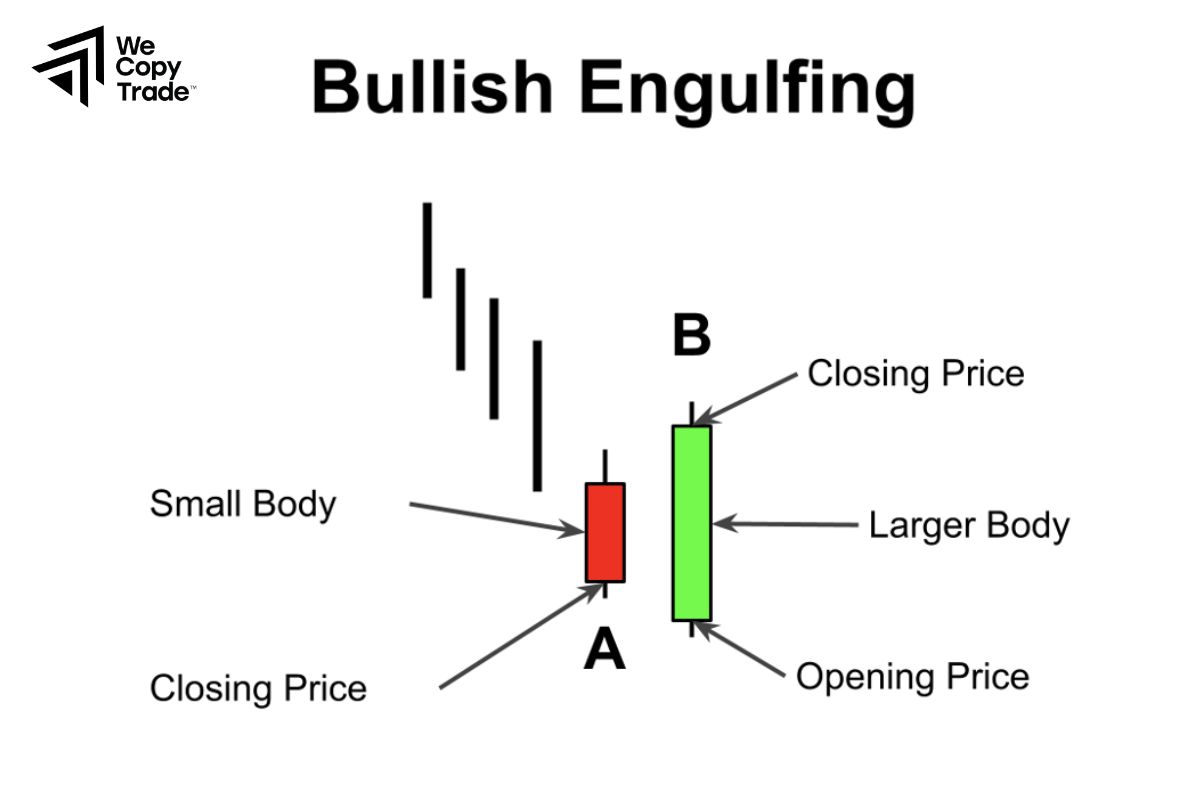
- Established Uptrend: These patterns form during an ongoing uptrend, indicating that the upward momentum is expected to continue after a brief consolidation or pause.
- Consolidation Period: A key feature is a period of consolidation or sideways movement, where the price briefly moves against the trend or stalls, allowing the market to gather strength before continuing the uptrend.
- Lower Volume During Consolidation: Volume typically decreases during the consolidation phase, reflecting reduced activity as buyers and sellers are in temporary equilibrium.
- Clear Support and Resistance Levels: These patterns often have well-defined support and resistance levels. A breakout above resistance confirms the pattern, signaling the continuation of the uptrend.
- Momentum Indicators: Indicators like the RSI or MACD often align with the pattern, confirming the strength of the bullish continuation by showing rising momentum or positive crossovers.
How does a continuation candlestick pattern work?
A continuation candlestick pattern works by signaling that the current market trend—whether bullish or bearish—is likely to persist after a brief pause or consolidation. Here’s how it functions:
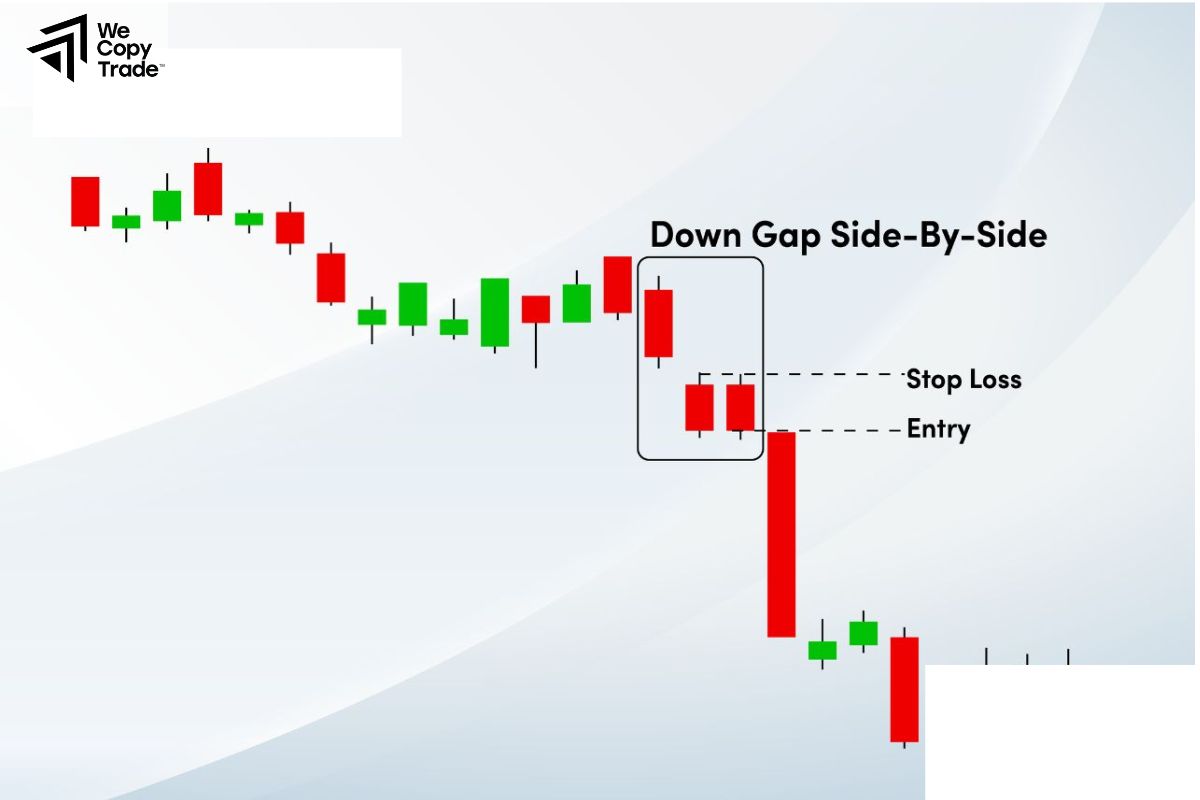
- Ongoing Trend: Before the pattern forms, the market is in a clear uptrend (bullish) or downtrend (bearish). Continuation patterns occur as part of the trend.
- Consolidation or Pause: The price temporarily moves sideways or slightly counter to the trend, indicating that the market is taking a “breather.” During this period, buyers and sellers are in equilibrium, causing a period of indecision.
- Pattern Formation: Specific candlestick formations, such as flags, pennants, or triangles, form during this consolidation. These patterns reflect the market’s temporary hesitation before continuing the trend.
- Breakout: The price breaks out of the consolidation pattern in the direction of the original trend. In bullish continuation patterns, the breakout happens upwards, signaling the continuation of the uptrend.
- Continuation of Trend: After the breakout, the previous trend resumes, with prices continuing to rise (in bullish patterns) or fall (in bearish patterns), offering a potential trading opportunity.
Popular types of bullish continuation candlestick patterns
Popular types of bullish continuation candlestick patterns include:
Bullish Flag
- Forms after a strong upward move, with the price consolidating in a small downward-sloping channel, resembling a flag. A breakout from the channel signals a continuation of the uptrend.
Bullish Pennant
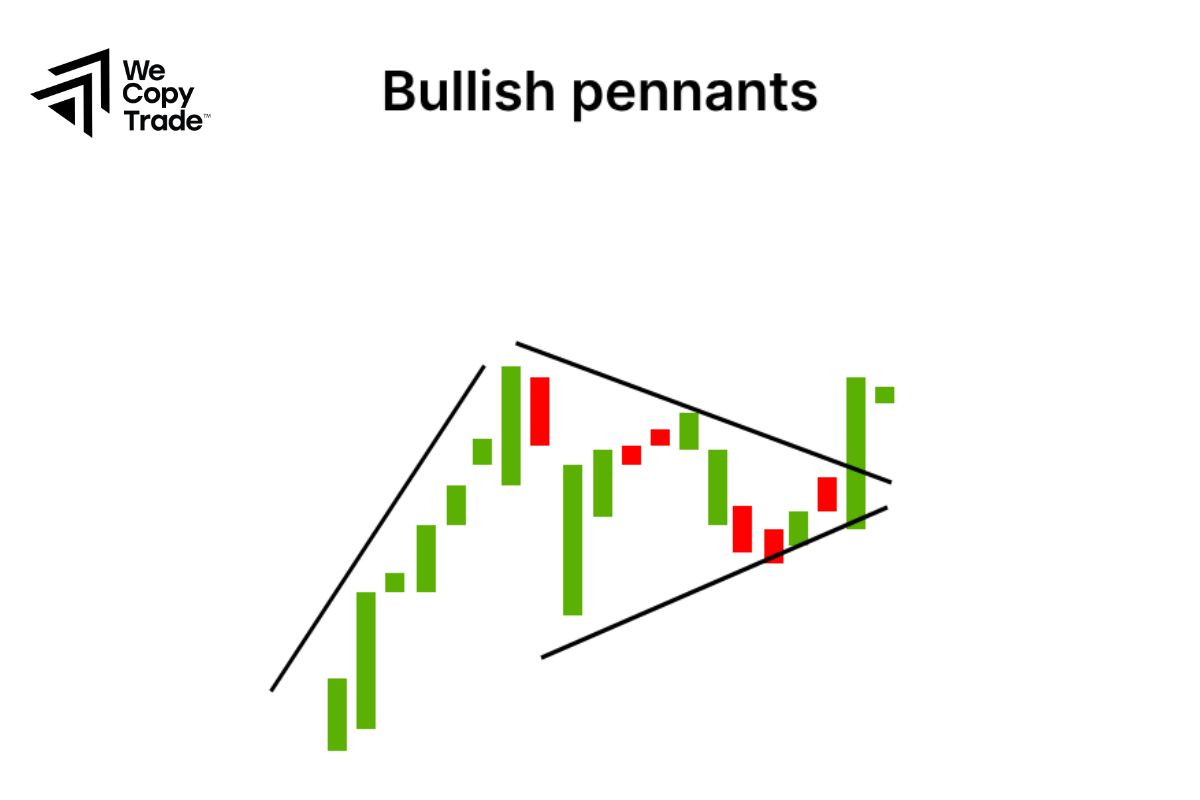
- Similar to the flag patterns but with converging trend lines that form a small triangle. After a sharp price rise, the pattern shows a brief consolidation before the next bullish move.
Ascending Triangle
- Characterized by a flat top and rising bottom, this pattern shows buyers pushing prices higher, with a breakout above the resistance indicating continued upward momentum.
Rising Three Methods
- This pattern includes three small bearish candles within a strong bullish move, showing a temporary pause before the continuation of the uptrend.
Cup and Handle
- A “U”-shaped consolidation (the cup) followed by a smaller dip (the handle), signaling the continuation of the bullish trend after a breakout from the handle.
A powerful bullish continuation candlestick patterns trading strategy
A powerful bullish continuation candlestick patterns trading strategy involves combining pattern recognition with key technical indicators to confirm the strength of the trend. Here’s a step-by-step strategy:
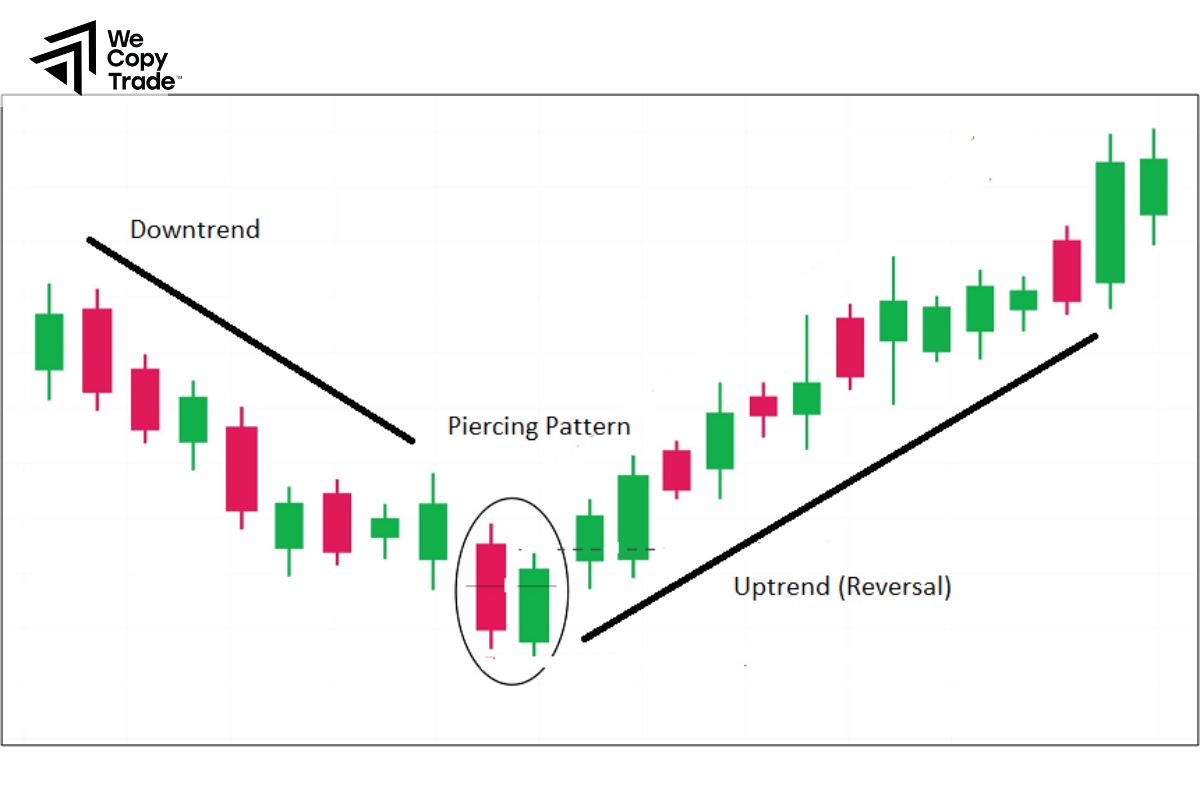
Identify the Uptrend
Ensure the asset is in a strong uptrend by checking moving averages (e.g., 50-day and 200-day) or trendlines. The asset’s price should consistently make higher highs and higher lows.
Spot the Bullish Continuation Pattern
Look for patterns like the bullish flag, pennant, or ascending triangle that form during a consolidation phase. These patterns signal a brief pause before the uptrend resumes.
Confirm with Volume
During consolidation, volume typically decreases, but as the price approaches a breakout, watch for an increase in trading volume. This confirms that momentum is returning in favor of the bulls.
Use Technical Indicators
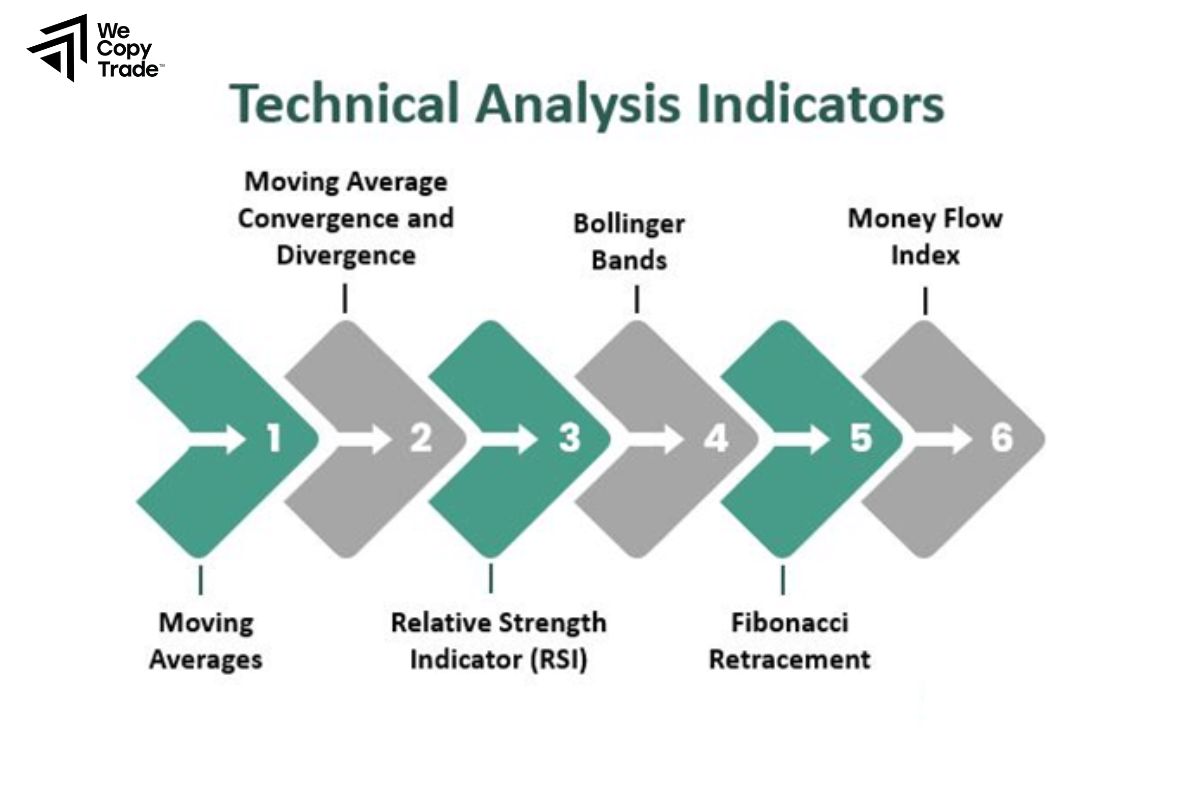
Add indicators like the Relative Strength Index (RSI) or Moving Average Convergence Divergence (MACD) to confirm momentum. An RSI above 50 or a MACD crossover can provide extra confidence that the trend is continuing.
Enter at Breakout
Once the price breaks out of the pattern e.g., above the resistance of a flag or pennant, enter the trade. The breakout confirms the continuation of the bullish trend.
Set Stop-Loss and Take-Profit
Place a stop-loss below the recent swing low (or the lower boundary of the pattern) to protect against false breakouts. Set a take-profit target based on the size of the pattern or using a 2:1 risk-to-reward ratio.
What is a bullish continuation candlestick pattern in technical analysis?
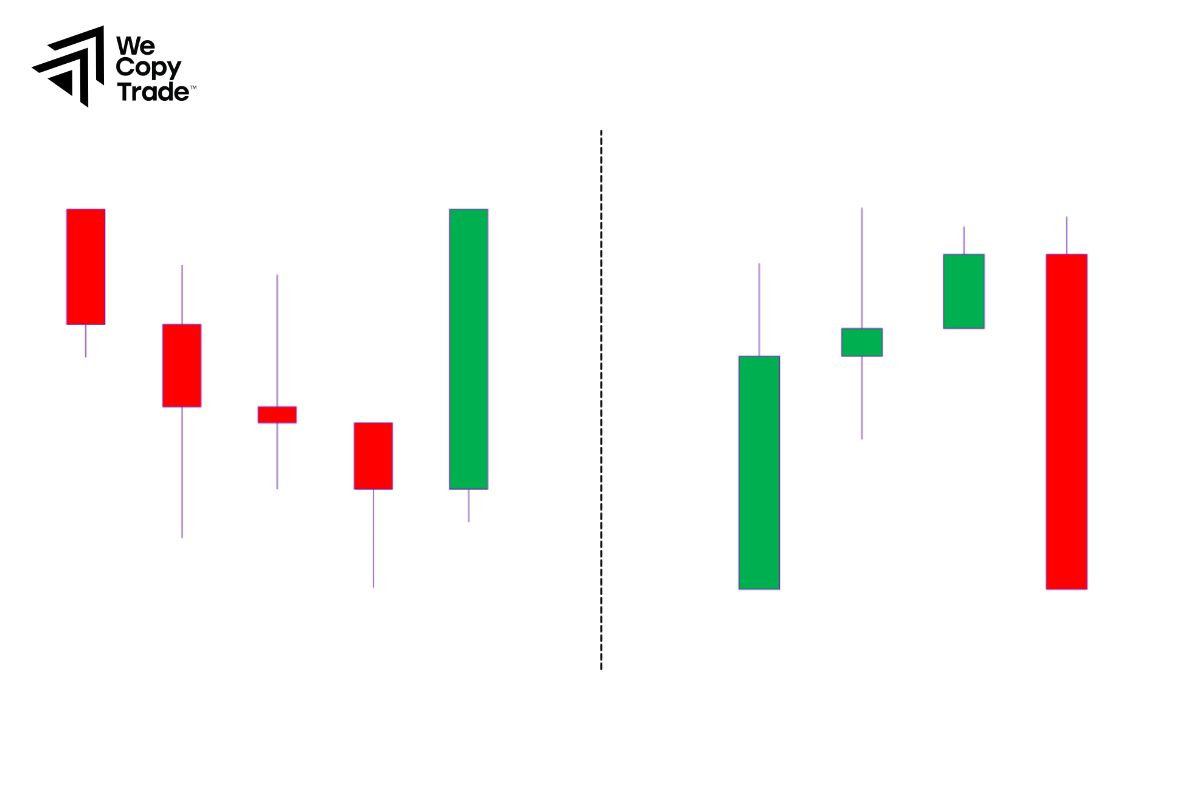
In technical analysis, bullish continuation candlestick patterns is a chart formation that appears during an existing uptrend and signals that the price is likely to continue moving upward after a brief consolidation or pause. These patterns reflect a temporary equilibrium between buyers and sellers before buyers regain control, pushing the price higher.
Common examples include patterns like the bullish flag, bullish pennant, and ascending triangle, all of which suggest that the market’s bullish momentum is intact and the uptrend will resume after a breakout. Traders use these patterns to identify potential entry points and to confirm that the existing trend remains strong.
Conclusion
In conclusion, mastering Bullish Continuation Candlestick Patterns is crucial for traders looking to capitalize on ongoing upward trends. These patterns offer valuable insights into market momentum and can significantly improve your trading decisions. Start incorporating these powerful tools into your strategy today and enhance your ability to predict market moves with confidence!
See more:





