












Trend lines are essential tools in technical analysis, helping traders and investors identify market direction and potential price movements. Whether you’re a seasoned trader or just starting, understanding how to effectively use trendlines can enhance your ability to forecast market behavior strategy. So, don’t leave your trades to chance and start incorporating trend lines into your analysis today!
What are Trend lines?

Trend line is a straight line drawn on a price chart that connects two or more significant price points to illustrate the price trend of an asset over time. By analyzing high and low price levels, trendlines help traders easily identify the market direction, indicating whether prices are rising, falling, or moving sideways.
Besides, identifying trend lines not only provides a visual representation of market trends but also assists investors in determining potential support and resistance levels. With this information, traders can make more accurate trading decisions and optimize their investment strategies. Effectively using trendlines can enhance the ability to analyze and predict price fluctuations, playing a crucial role in success in financial trading.
What is the Importance of Trend lines?
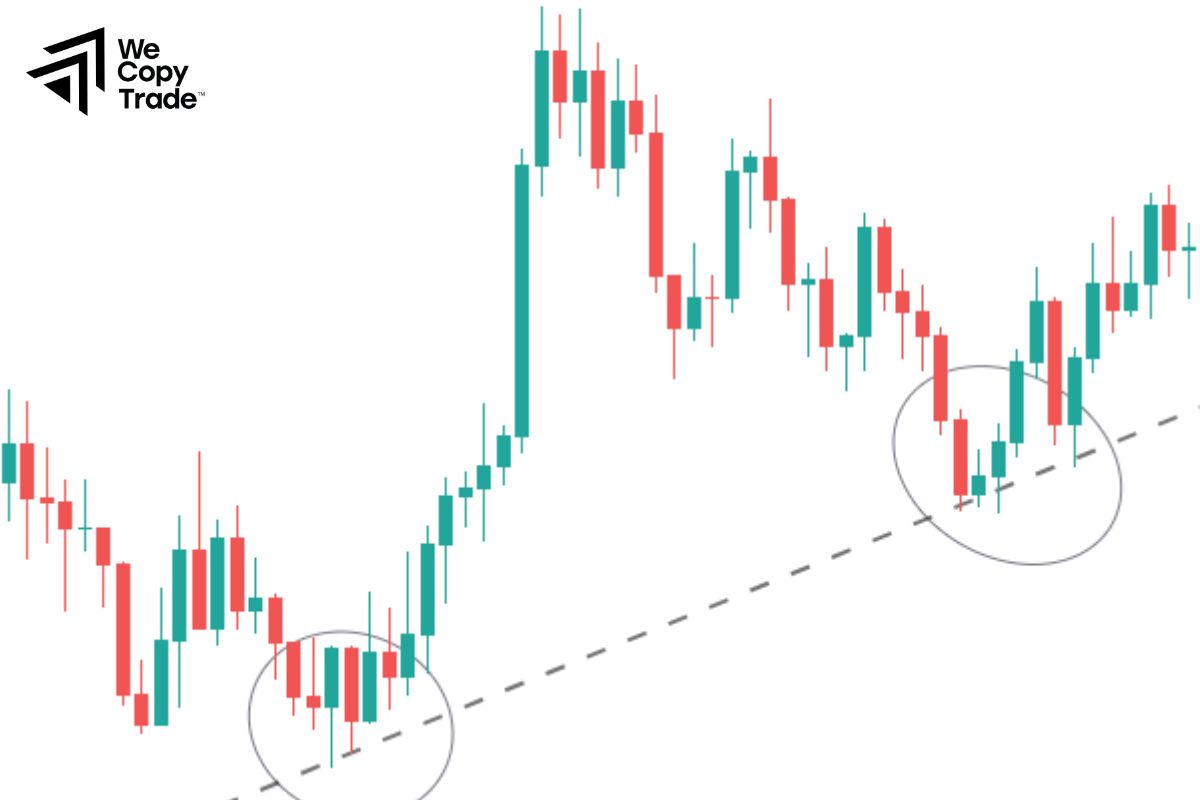
Trend lines are vital tools in technical analysis, as they provide clear insights into market direction by indicating whether prices are trending upward, downward, or moving sideways. They often serve as support and resistance levels, helping traders identify optimal entry and exit points.
Additionally, trendlines can confirm trade signals, assist in risk management through strategic stop-loss placements, and forecast future price movements by extending into the future. By understanding market sentiment through the slope of trendlines and enhancing analysis with other technical indicators, traders can make more informed decisions, ultimately improving their chances of success in financial markets.
What Are the Types of Trend lines?
Trend lines are essential tools in technical analysis, and they can be categorized into several types based on their direction and application. Here are the main types of trendlines:

Uptrend Line
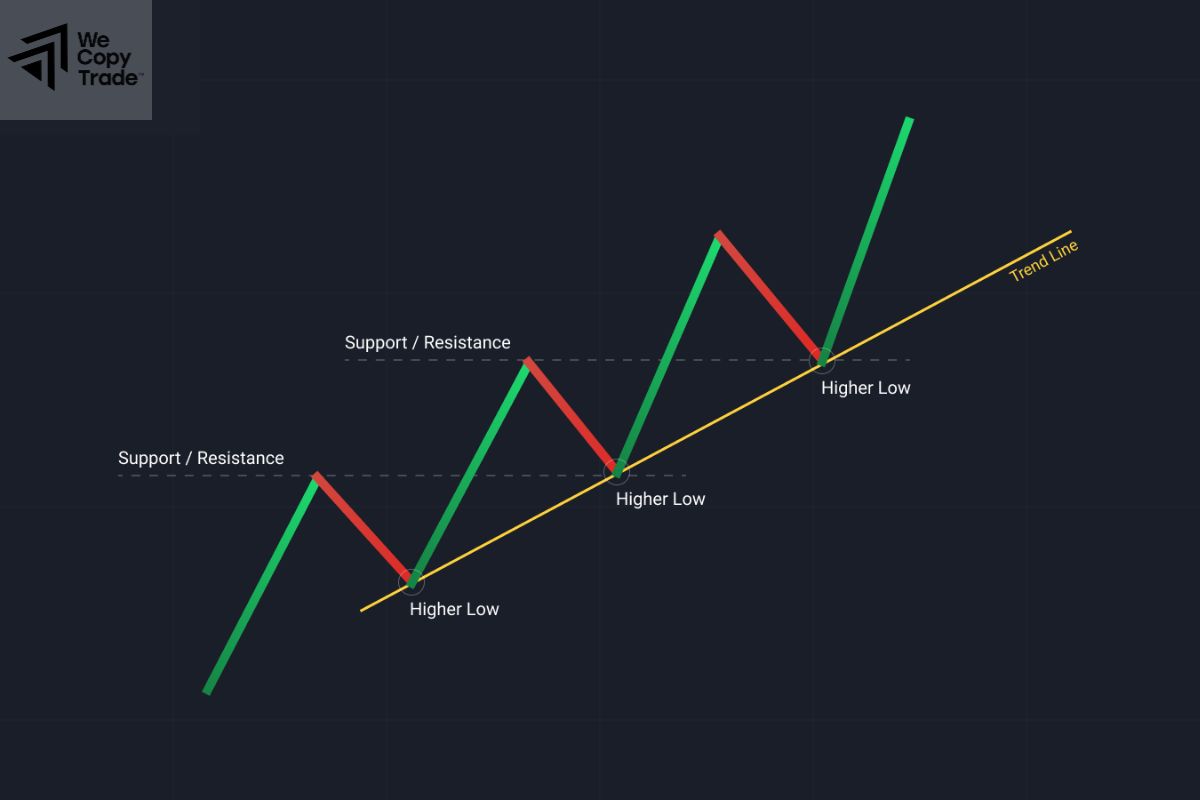
- An uptrend line is drawn by connecting a series of higher lows on a price chart. It indicates a bullish market sentiment, where prices are generally rising over time.
- Traders use uptrend lines to identify potential buying opportunities, as prices often bounce off this line.
Downtrend Line
- A downtrend line is created by connecting a series of lower highs on a price chart. It signifies a bearish market sentiment, where prices are declining.
- Traders look for selling opportunities when prices approach the downtrend line, anticipating a potential bounce downward.
Horizontal Trend Line
- Horizontal trend lines are drawn parallel to the x-axis and are used to identify key support and resistance levels. They indicate price levels where the stock has historically reversed or consolidated.
- These lines help traders determine when to enter or exit positions based on price action around established support or resistance levels.
Trend Channel
- A trend channel consists of two parallel trend lines, one representing an uptrend and the other a downtrend. This creates a channel within which prices move.
- Traders can use channels to identify potential buy and sell zones, as prices tend to bounce between the upper and lower trendlines.
Dynamic Trend Lines
- Unlike fixed trend lines, dynamic trendlines adjust as new price data emerges. They can be based on moving averages or other indicators.
- Dynamic trend lines provide a flexible approach to analyzing trends, adapting to changing market conditions.
How to Draw Trendlines for Beginners?
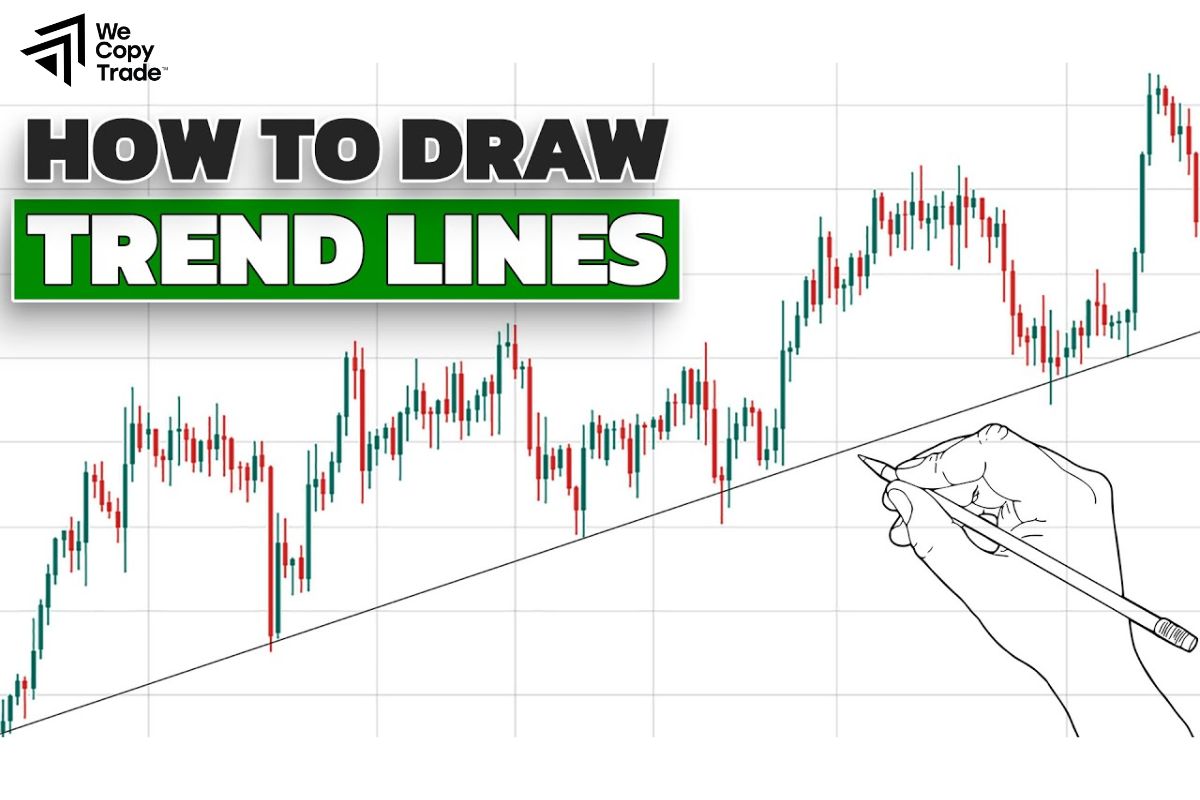
Here is a beginner’s guide on how to draw effective trend lines:
Step 1: Choose Your Chart
First, open the price chart for the asset you want to analyze, including stocks, forex, cryptocurrencies, etc., using your trading platform or charting software.
Step 2: Identify Key Points
- In this step, look for key price points on the chart. These include significant highs (peaks) and lows (bottoms).
- In an uptrend, focus on connecting lower lows. In a downtrend, focus on connecting higher highs.
Step 3: Choose the Right Tool
Most charting platforms have a trend line tool. Select this tool to start drawing.
Step 4: Draw a Trend Lines
- For an uptrend line: Click on the first significant low and drag the line to connect the next lower low. Make sure the line touches at least two or more lows.
- For a downtrend line: Click on the first significant high and drag the line to connect to the next higher high. Again, make sure it touches at least two or more highs.
Step 5: Extend the Line
Extend the trend line into the future to predict potential price movements. This helps identify future support or resistance levels.
Step 6: Confirm with Other Indicators
Finally, use additional technical indicators such as moving averages or RSI to confirm the signals provided by your trend lines. This can increase the reliability of your analysis.
What are the Pros and Cons of Trend lines?

Pros of Trendlines
- Trend lines provide a clear and easy-to-understand visual representation of market direction, making it simpler for traders to assess trends at a glance.
- They help identify key support and resistance levels, enabling traders to make informed decisions about entry and exit points.
- Trend lines can confirm signals from other technical indicators, providing additional confidence in trading decisions.
- By indicating potential reversal points, trend lines assist traders in placing stop-loss orders strategically to manage risk.
- The angle and slope of trend lines can indicate the strength of market sentiment, helping traders gauge whether to buy or sell.
Cons of Trendlines
- Drawing trend lines can be subjective, as different traders may connect different points, leading to varying interpretations of market trends.
- Trendlines are based on historical price data and may lag behind current market movements, which can result in missed opportunities or delayed reactions.
- Prices can break trendlines without a genuine change in trend, leading to false signals and potentially costly trades.
- Trendlines do not provide fundamental analysis or context for price movements, which can be critical for making informed trading decisions.
- Trendlines need to be regularly adjusted as new price data emerges, requiring ongoing attention from traders.
Where Are Stock Trend Lines Used?
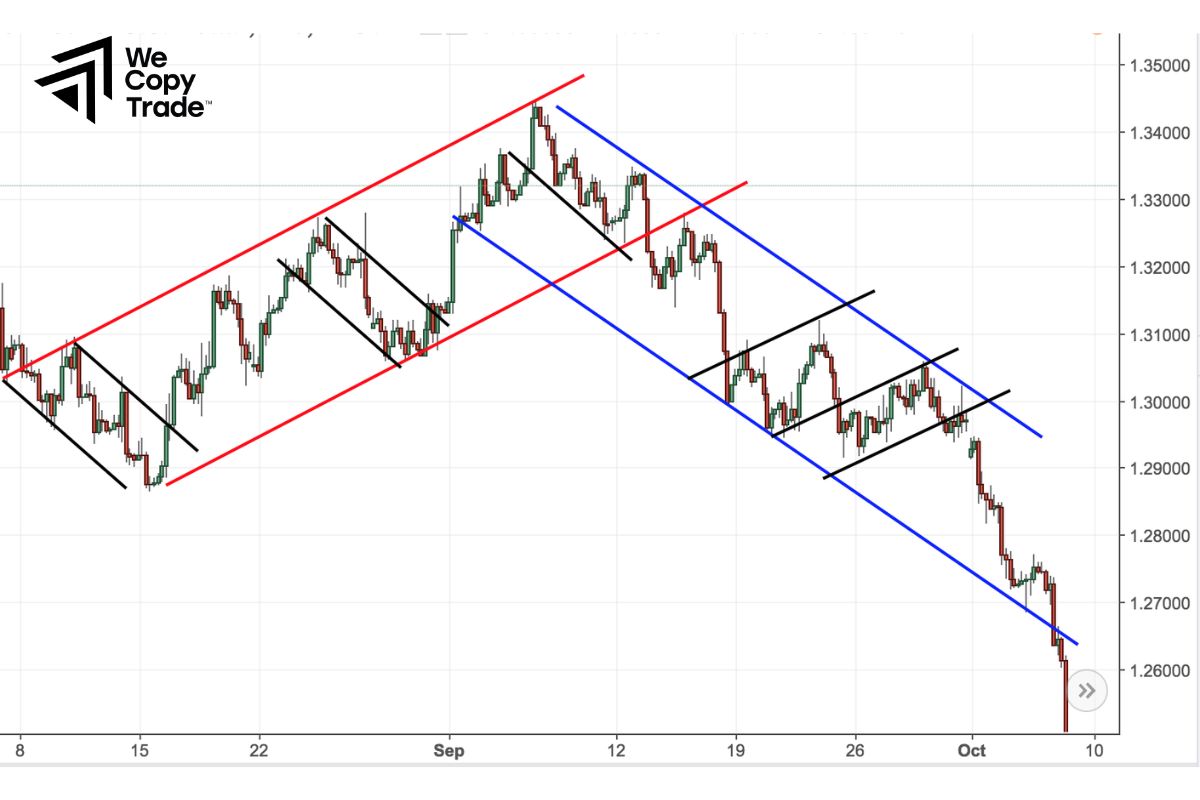
Stock trend lines are used in various aspects of market analysis, primarily in technical analysis to visualize price movements and identify trends. They help traders pinpoint support and resistance levels, allowing for informed entry and exit decisions.
Additionally, swing traders and day traders utilize trendlines to identify short-term price swings and make quick trading decisions. Long-term investors rely on them to evaluate overarching market trends, while trend lines also aid in risk management by helping set stop-loss orders. Overall, trendlines are essential tools for making informed trading and investment decisions in the stock market.
What Are the Different Scaling Settings for Trend lines?
When drawing trend lines in stock analysis, different scaling settings can impact how the trendlines are perceived and analyzed. Here are the common scaling settings used for trendlines:
Linear Scale
- In a linear scale, both the price and time axes are divided into equal intervals. This setting is useful for short-term analysis, allowing for straightforward visual interpretation of price movements.
- Ideal for assets with consistent price movements, making it easier to identify trends.
Logarithmic Scale
- A logarithmic scale displays price changes in percentage terms rather than absolute values, which compresses large price movements while expanding smaller movements. This setting is effective for analyzing assets that experience significant price fluctuations over time.
- Best for long-term analysis, particularly for stocks that have undergone substantial growth or decline.
Percentage Scale
- A percentage scale shows price changes as a percentage of the starting value. This setting helps visualize relative changes in price over time.
- Useful for comparing performance across different assets or indices, as it normalizes price movements.
Are Trend lines Only Applicable to Candlesticks?
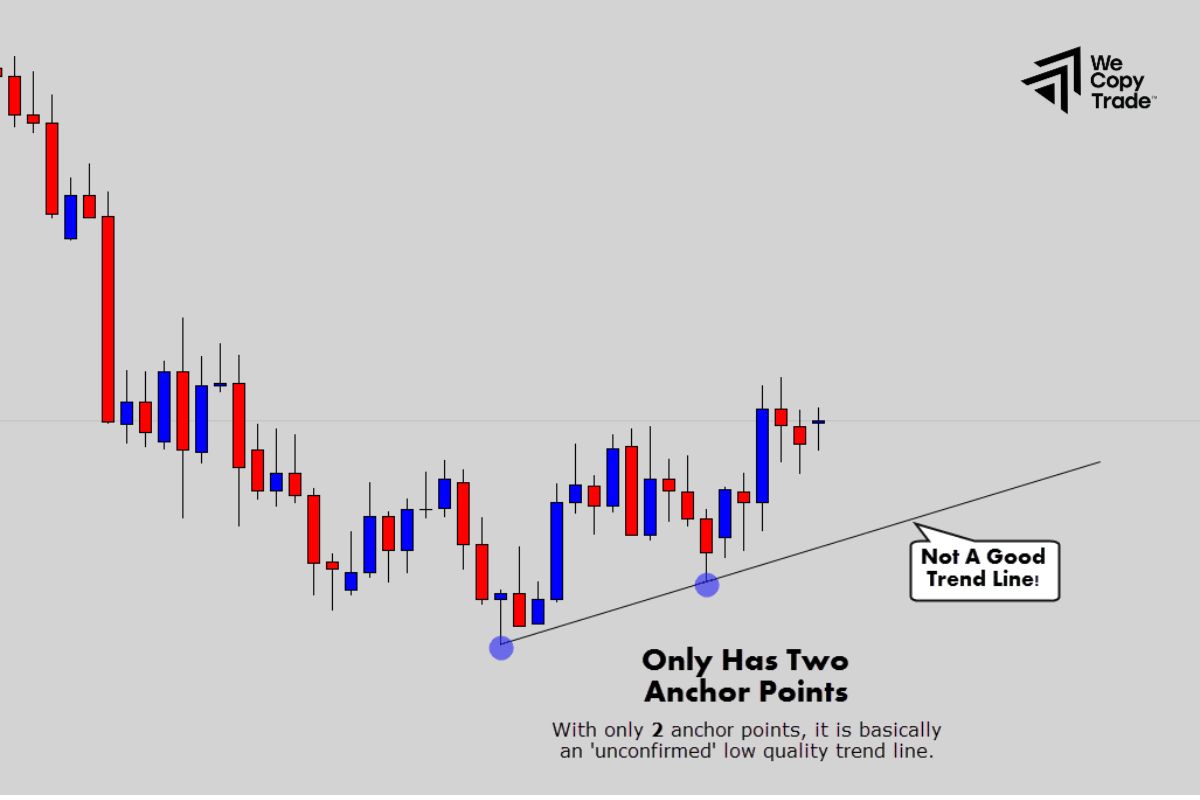
No, trend lines are not limited to candlestick charts; they can be applied to various types of charts in technical analysis. For instance, trendlines can be drawn on line charts to visualize overall price trends, bar charts to analyze open, high, low, and close prices, and point and figure charts to focus on significant price movements without considering time. They can also be used in Renko charts, which filter out minor fluctuations, and Heikin-Ashi charts that use modified candlesticks. Overall, trend lines are versatile tools valuable for identifying trends across different chart formats, aiding in informed trading decisions.
Do Trend lines Serve the Same Purpose as Channels?
No, trend lines are not limited to candlestick charts; they can be applied to various chart types in technical analysis. Trend lines can be used on line charts, which connect closing prices, as well as on bar charts that display open, high, low, and close prices. They are also applicable to point and figure charts, which focus on significant price movements, and Renko charts, which filter out minor fluctuations. Additionally, trendlines can be drawn on Heikin-Ashi charts, which utilize modified candlesticks. Overall, trendlines are versatile tools useful for identifying trends across different chart formats.
Conclusion
In conclusion, trend lines are essential tools for traders and investors looking to analyze price movements and identify market trends effectively. Don’t miss out on the potential advantages trendlines offer. Start incorporating them into your trading toolkit today to make more informed decisions and optimize your trading success!





