












The Doji candlestick pattern is extremely popular in investment analysis. Are you feeling confused with too many strange numbers and symbols on the chart? Don’t worry, this is also an understandable psychology for new traders. Let’s learn with me step by step about the steps to conquer this candlestick pattern as well as the trading market!
What Is a Doji Candlestick?
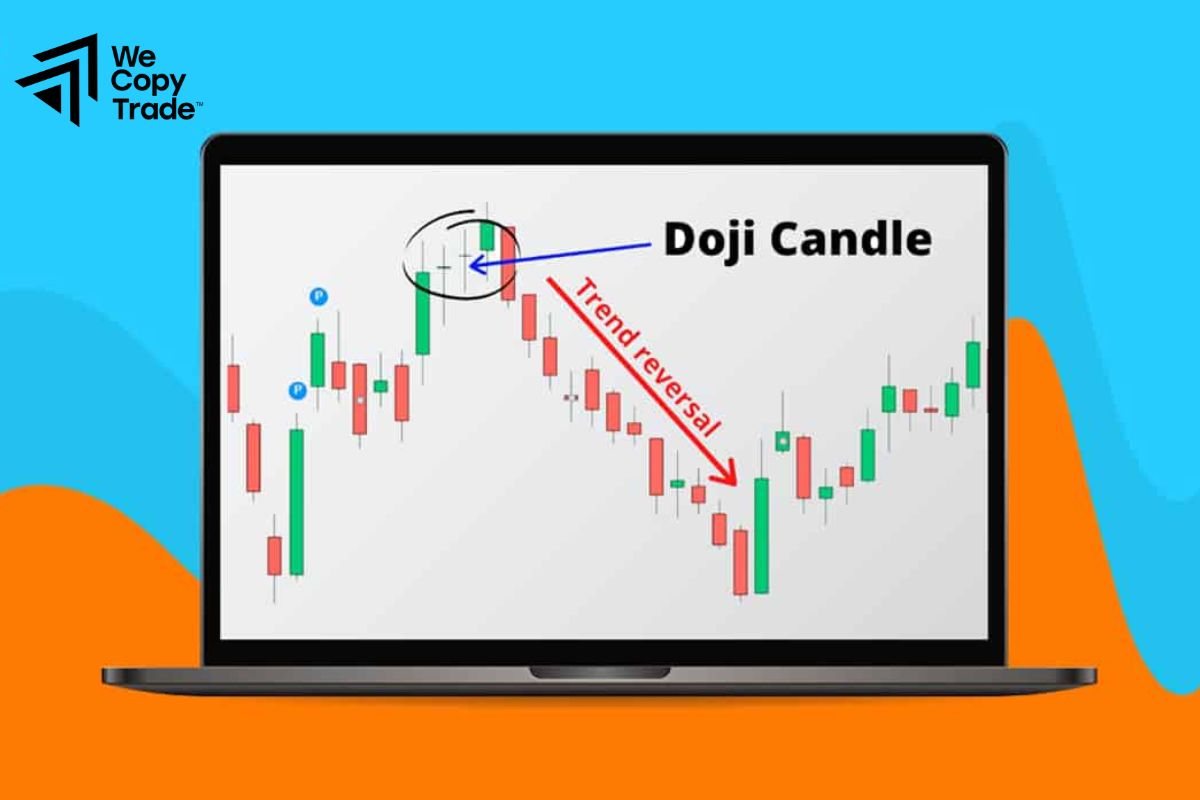
Doji candlestick is one of the most popular candlesticks in market analysis. With a short body and long shadow, the candlestick looks like a white flag in the battle between buyers and sellers. When a doji candle appears, it shows that the strength of buyers and sellers is equal. Another interesting point about Doji candlestick is that based on where it appears on the chart, we can infer the psychology and the next developments of the market.
See now:
- Top Common Types Of Chart Patterns Trading For Beginners
- Best Popular Types of Reversal Patterns Candlestick
- Symmetrical Triangle Patterns in Trading You Should Know
- What are Continuation Patterns? Common Types of Patterns
How is a Doji Candlestick Pattern Formed?
A Doji candle forms as a result of a draw between buyers and sellers. The closing price of that trading session is almost equal to the opening price, forming a candle with a very short body, resembling a plus sign (+) on the chart.

The special shape of the Doji candle helps investors predict what may happen next. When a Doji candle appears, there are usually two possibilities:
- A Doji candle can signal a major change is about to happen. For example, if a Doji candle appears at the top of an uptrend, it can indicate that selling pressure is increasing and prices may fall.
- A Doji candle can also indicate that the market is in a state of uncertainty, with not enough information to make a clear decision.
What are the Types of Doji Candlestick Patterns?
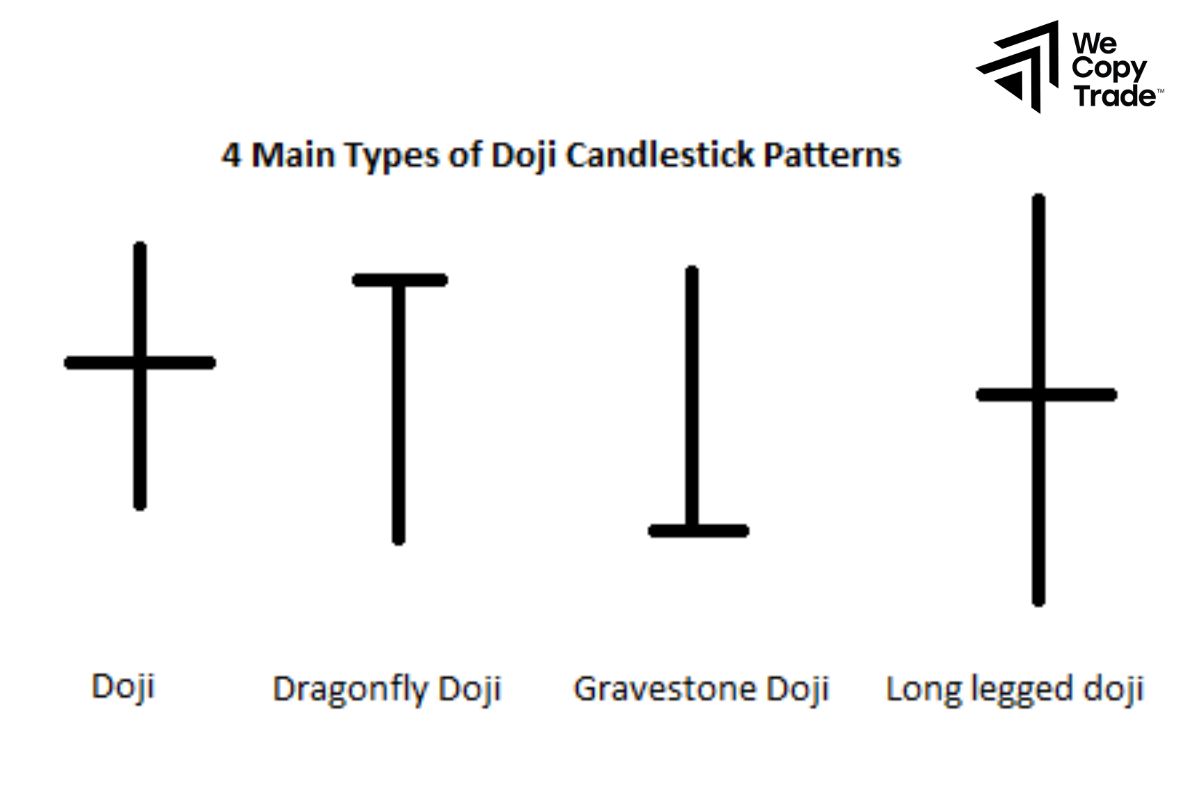
In addition to the basic shape, Doji candlestick also have many interesting variations, each providing different useful information about market psychology such as:
Dragonfly Doji
As the name suggests, this candlestick pattern is shaped like a dragonfly resting on the water surface with a long “tail” at the bottom, indicating that the price fell sharply at the beginning of the session but eventually recovered. This is usually a positive signal, indicating that buying power is increasing.
Gravestone Doji
In contrast to the Dragonfly Doji, the Gravestone Doji has a high “flame” at the top, indicating that the price rose sharply at the beginning of the session but was then pushed down. This is usually a warning signal, indicating that selling power is dominant.
Bearish Gravestone Doji
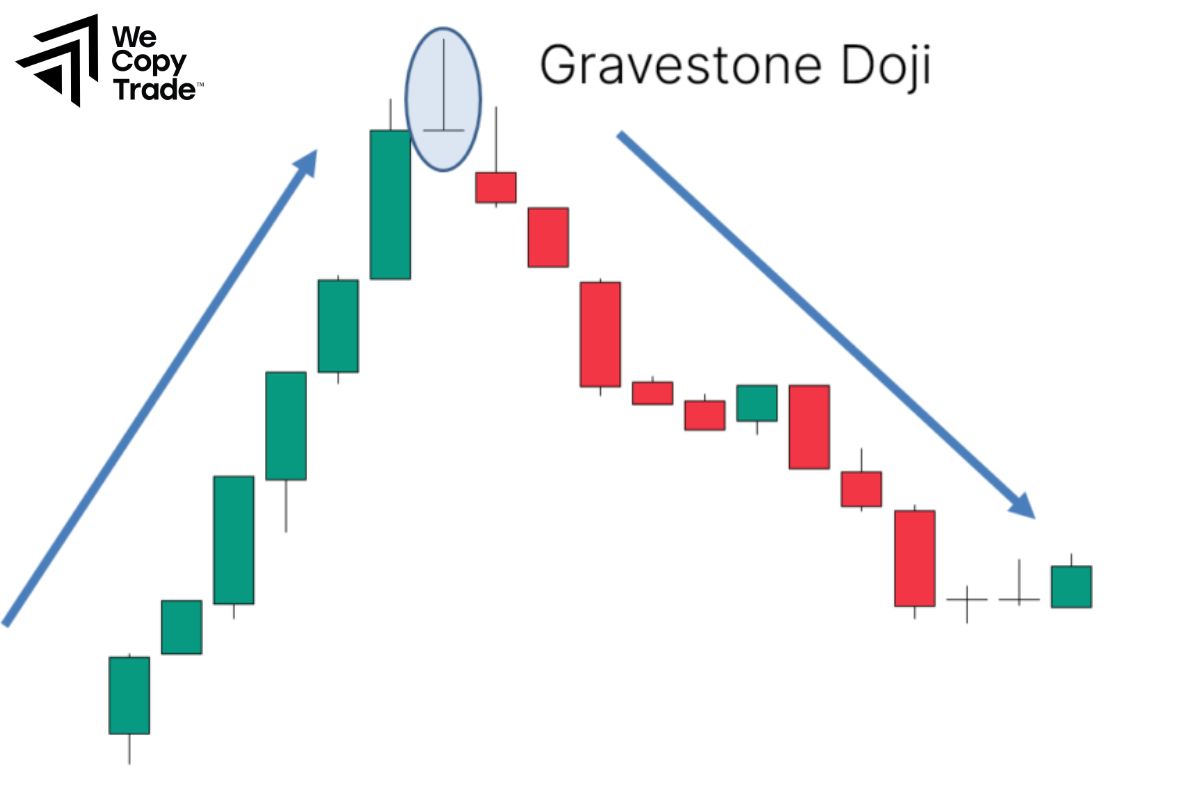
The bearish Gravestone Doji candlestick often appears near the top of a downtrend. With a very long upper gravestone and a square lower gravestone, indicating that the price tried to increase but was pushed down sharply. This is a warning signal that selling pressure is dominant and prices may continue to fall.
Long-Legged Doji
The Long-Legged Doji candlestick resembles a battle between bulls and bears. Prices fluctuate wildly throughout the trading session, creating very long “legs” on both sides. However, in the end, both sides are exhausted and the price closes near the opening price.
After a rally, the Long-Legged Doji can signal that buying pressure is weakening and prices may fall. After a decline: The Long-Legged Doji can signal that selling pressure is weakening and prices may rise. And In a sideways market, the long-legged Doji shows investors’ hesitation, they are not sure whether to buy or sell.
In other words, the Long-Legged Doji is like a big question mark, indicating that the market is in a state of uncertainty
Doji Star Pattern

The Doji Star is an important signal on the chart, helping investors predict a change in trend. Its shape resembles a small star, located between other candles. There are two main types of Doji stars:
- Bullish Doji Star: Appearing after a decline, the bullish Doji star is like a ray of hope for buyers. It shows that buying power is gradually returning and prices may rise in the future. To confirm this signal, prices need to close above the high of the previous candle.
- Bearish Doji Star: In contrast to the bullish Doji star, the bearish Doji star appears after a rise and signals a possible trend reversal. It shows that selling power is dominant and prices may fall in the future.
Bearish Doji Star
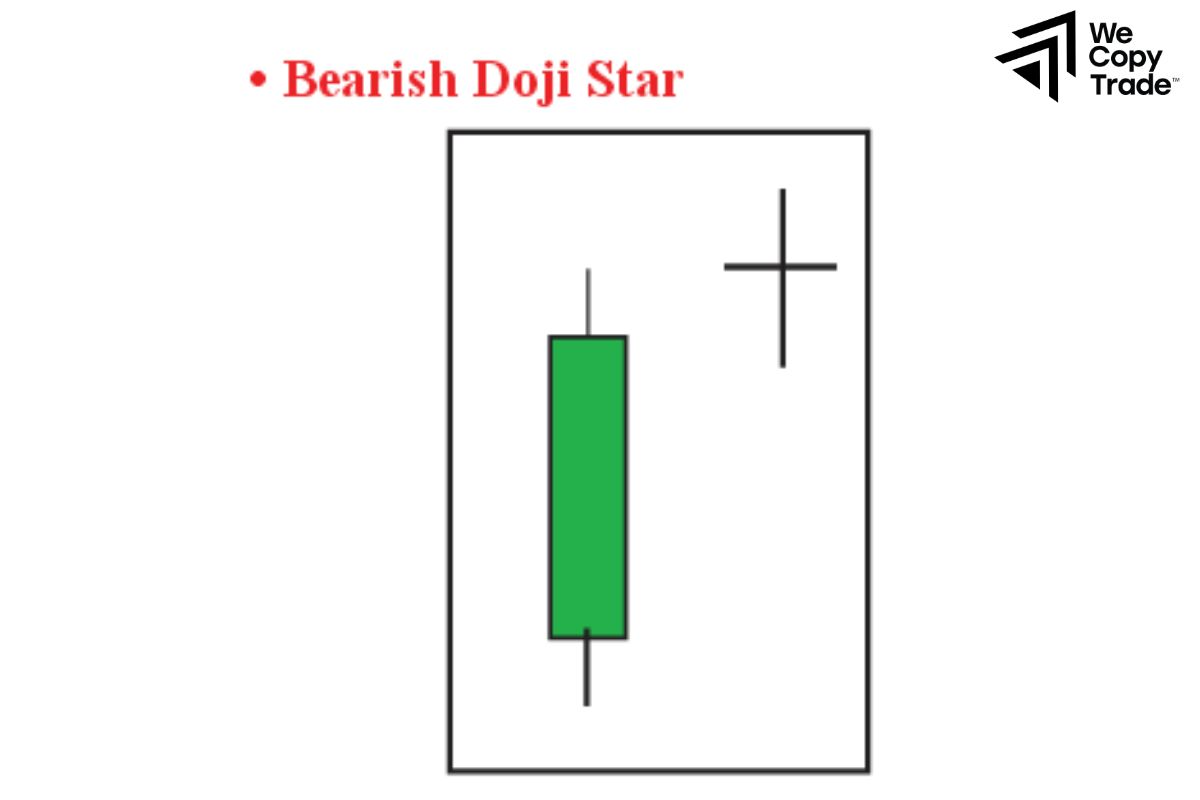
The bearish Doji star usually appears after a strong rise. Like a shooting star falling from the sky, it signals a major change is about to happen. This star shows that the uptrend is weakening and may reverse into a downtrend. Its shape resembles a plus sign, but is below the previous candle.
When a bearish Doji star appears, investors need to be careful because the price may fall sharply in the near future.
Hammer Doji
A hammer Doji candlestick is a signal that buying power is returning. Its shape resembles a hammer, with a short body and a long “hammer” at the bottom. When a hammer Doji appears, it means that the price has fallen deeply, but buying power has intervened and pushed the price back near the opening level. There are 2 common cases with this type of Doji:
- Reversal Hammer Doji: When a hammer Doji appears after a decline, it usually signals an upward reversal.
- Hanging Doji: Conversely, if a hammer Doji appears after an upward price movement, it is called a hanging Doji and signals a possible downward reversal.
However, to confirm the reversal signal, the price needs to close above (for a hammer Doji) or below (for a hanging Doji) the next candle.
Secrets to successful trading with Doji candles

First, we need to prepare an account to trade with Doji effectively through the basic steps:
- Open an account: Choose a reputable broker and open a trading account. You can start with a demo account to familiarize yourself with the platform and practice your strategy before trading with real money.
- Choose a market: Doji candles appear in almost every market, from forex, cryptocurrencies to stocks. Choose a market that you are familiar with and interested in.
- Use a trading platform: Your trading platform will provide you with the tools you need to analyze charts, place orders, and manage risk. Take advantage of features like candlestick charts, technical indicators, and stop-loss orders to protect your capital..
Doji candlestick is not only a special shape on the chart, but also an important signal that helps us predict market movements. To make the most of the information that Doji candlestick bring, we can combine it with different technical indicators and trading strategies:
Doji Star and Stochastic Indicator
When a Doji Star appears at the bottom of a downtrend, it can be a sign that the market is about to reverse. To confirm this signal, we can use the Stochastic indicator. If the Stochastic indicator shows that the market is in the overbought zone, the possibility of a reversal increases significantly.
Dragonfly Doji and Support Levels
Dragonfly Doji often appears near important support levels. When a Dragonfly Doji forms near a support level, it is a strong buy signal. To increase safety, you can place a stop loss order below the low of the Doji candle.
Double/Triple Doji Strategy
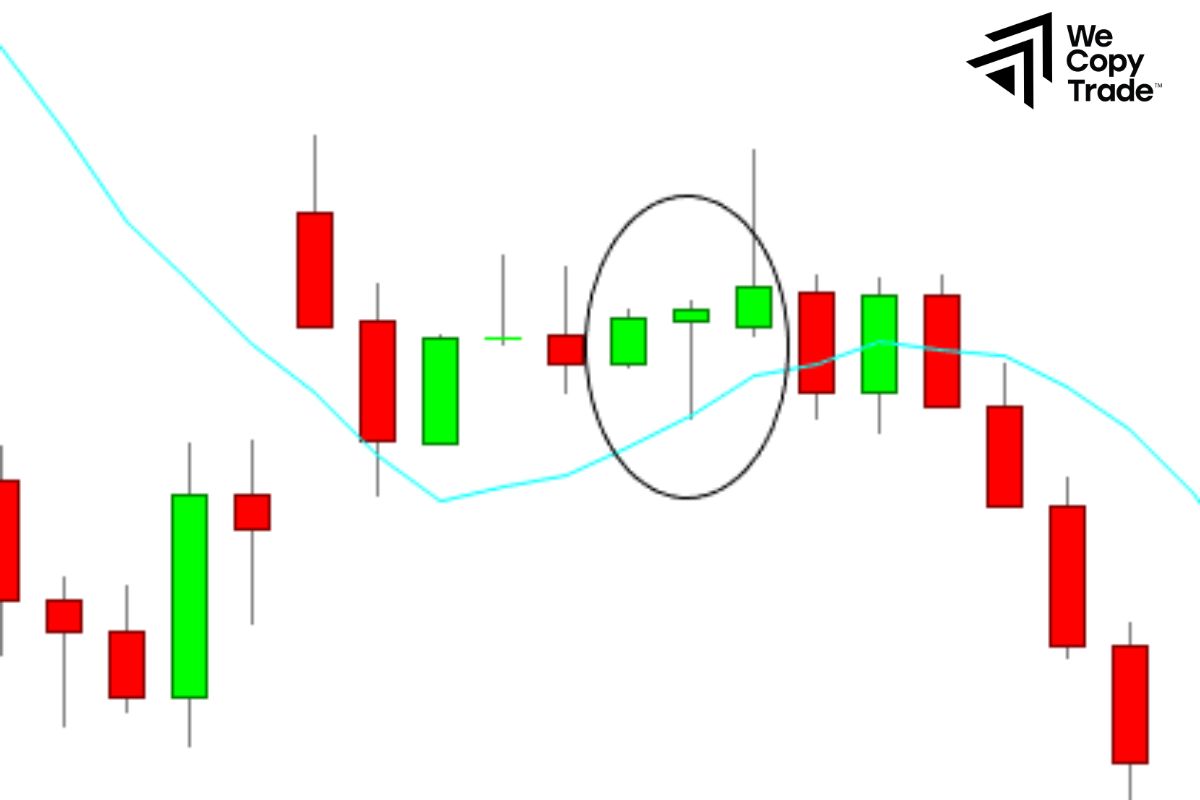
When two or three Doji candles appear in a row, it is a sign that the market is very indecisive. After the Doji candle series appears, the market usually makes a strong move. You can place a buy order when the price breaks the high of the Doji candle series and place a stop loss order below the low of the candle series.
Conclusion
In conclusion, through this article, I am sure that if you understand these Doji candlestick patterns, the path to success in your trading is not far away. Start applying them today!
See more:





