












Each indicator in technical analysis will have its own specific meaning. You already know what trading volume is, right? So how do we measure it? Now let’s answer the questions and learn about the tools that help us “read” the market based on trading volume, which are volume indicators.
What is the Trading Volume?
Trading volume is calculated based on the number of shares or contracts bought and sold, usually in 1 day. It is similar to the number of goods traded in a market session.
Volume is not just a number, but also a “lens” that helps us see more clearly the complex developments of the market.
Why is volume important?
- Helps us understand market dynamics and answer the question: “Why is the price going up or down?”. By analyzing the relationship between volume and price movements, we can gain valuable insights into the underlying market dynamics.
- Helps us predict whether a trend is likely to continue. When volume moves in the same direction as the trend, it shows that the trend is strong. Conversely, if volume decreases, it can be a sign of weakness.
- Helps us find the best entry points. When volume suddenly increases, it can be a signal that a new trend is forming.
- Reflects the general sentiment of investors. When volume is high, it shows that investors are very interested in a stock or the market.
- Helps us identify the presence of large buy/sell orders from influential organizations or individuals.
See now:
- The Most Effective Way to Draw Trend lines for Beginners
- Guide to trading with Diamond Pattern in Forex effectively
- How To Use The Double Top and Bottom Patterns Effectively
How to Calculate Trading Volume
- Measurement Unit: Trading volume is usually measured in shares, contracts, or other trading units. For example, if you are trading stocks, trading volume would be calculated by the number of shares bought and sold.
- Time: Trading volume can be calculated for a certain period of time, such as a day, a week, or a month.
- Measurement: To calculate trading volume, simply add up the total number of shares (or other trading units) bought and sold during that period.
Illustrative example:
Let’s say you are tracking a stock XYZ. During a trading day, 500 shares of XYZ were bought and 1,000 shares of XYZ were sold. So the trading volume of XYZ stock that day is 1,500 shares.
Volume Indicators
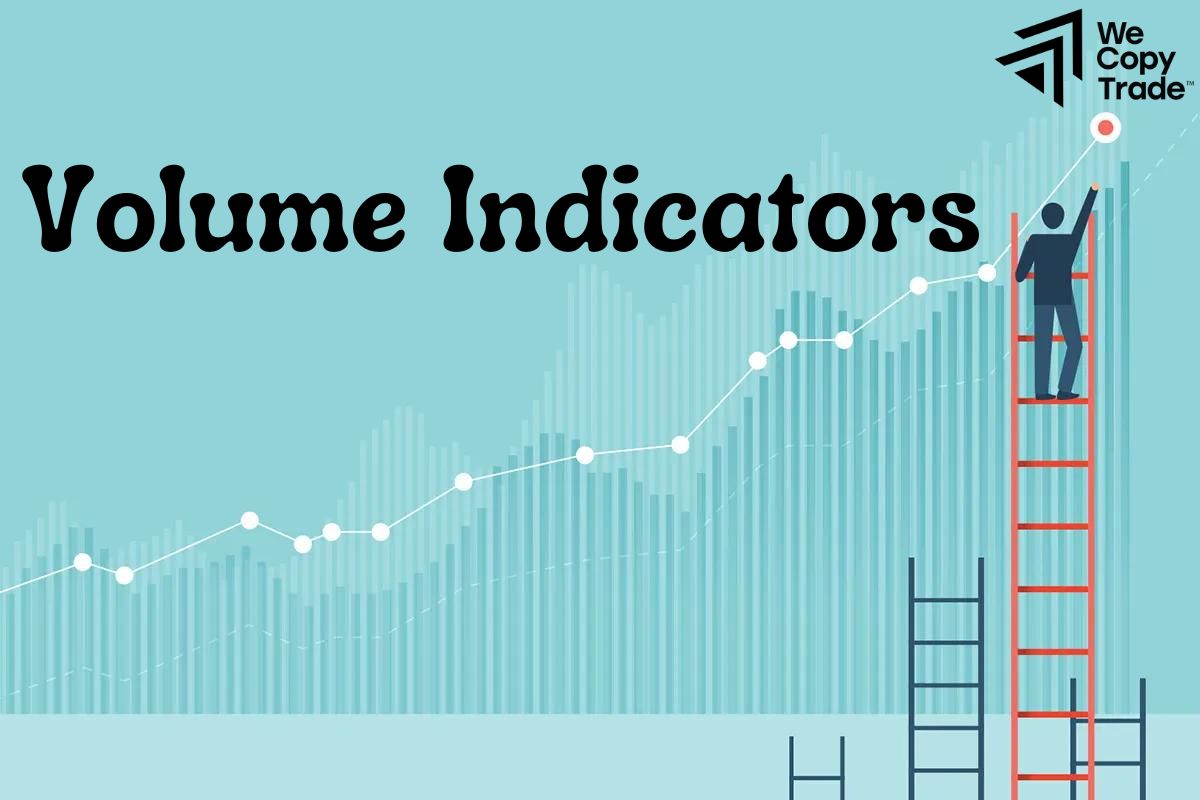
The volume indicator displayed in the market is the result of comparing the number of transactions with the price fluctuations. Simply put, this indicator helps measure the strength of a trend by determining whether buyers or sellers are dominant in the market.
Some popular volume indicators:
- On-balance volume (OBV): OBV compares the trading volume of up and down sessions to assess the strength of the trend. When price increases and volume increases, OBV also increases, indicating a strong uptrend.
- Chaikin money flow: This indicator focuses on measuring the flow of money into and out of a stock. When money flows in strongly, the indicator increases, and vice versa.
- Klinger oscillator: This oscillator synthesizes the cumulative and distributed volume over a certain period of time to determine the relative strength of buyers and sellers.
Trading Volume and Momentum
Trading volume is an important indicator that helps investors better understand the driving force behind the price movements of a stock or a market.
When volume increases in the same direction as the price trend, it indicates that the trend is strong and likely to continue. Conversely, if volume decreases while the price continues to rise or fall, it could be a sign of an impending reversal.
Volume is a positive sign if it increases in the same direction as the price trend, meaning that investors are very interested in the market. Conversely, if volume decreases while the price continues to rise or fall, it could be a signal of a trend reversal.
Investors can use volume to better identify entry and exit points. For example, when volume spikes at a new price level, it could be a sign that a new trend is forming.
The Relationship Between Volume and Price
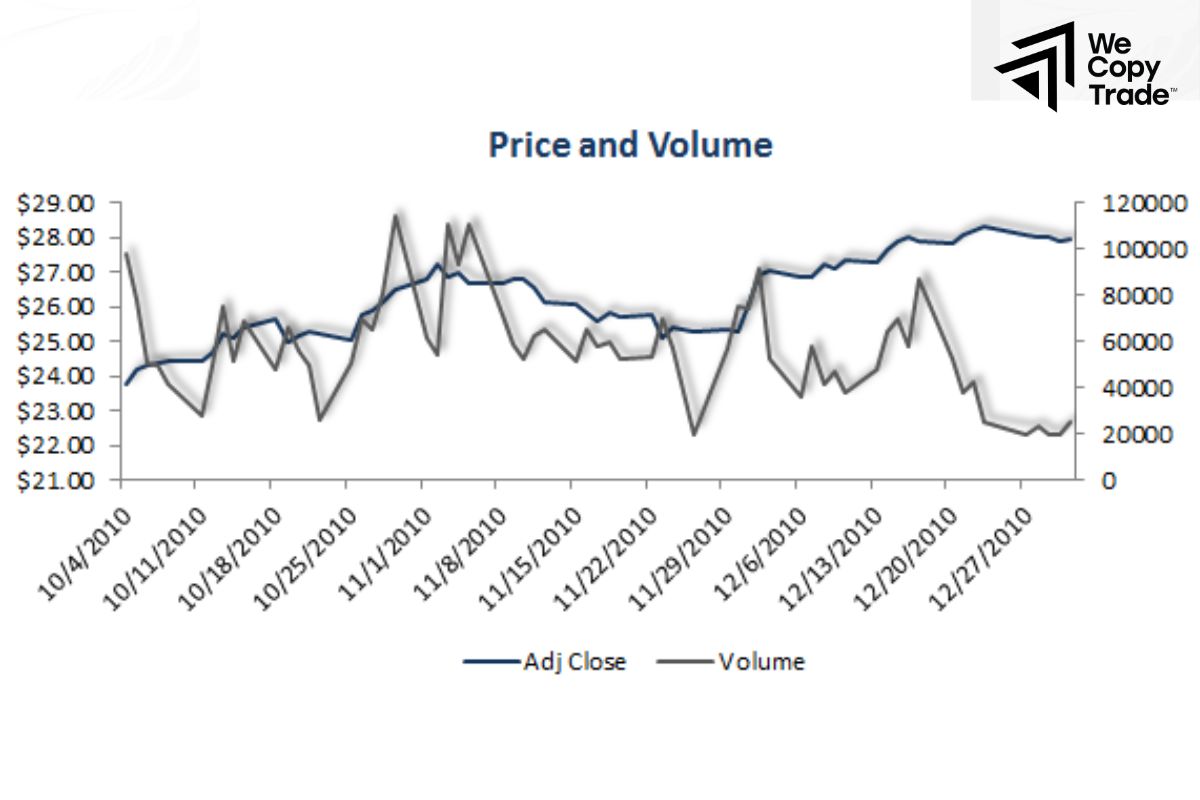
Volume Leading Price: Trading volume will typically increase before price begins to move. This indicates that a large buying or selling force is building and is about to cause a price move.
- Volume Confirms Trends: When price and volume move in the same direction, it confirms the current trend.
- Volume Divergence: When price and volume move in opposite directions, it is a warning signal.
Distinguish Bullish Signals vs Bearish Signals
When participating in the financial market, it is very important to recognize trading signals to determine price trends and make informed investment decisions. Let’s explore the difference between bullish and bearish signals in more detail below:
Bullish Signals from Trading Volume
If the volume on the breakout is significantly higher than average, it indicates that there are a lot of investors in the game and believe that the stock will continue to rise. Conversely, if the volume on the breakout is low, it may indicate that investor interest is not really high and that a trend reversal is likely.
A truly strong uptrend is always accompanied by increasing volume. When volume increases steadily in an uptrend, it indicates that there is a lot of money flowing into the stock and that the trend is likely to continue.
Conversely, if the stock price continues to rise but the volume decreases, it indicates that the strength of the trend is weakening and a reversal may be imminent.
Bearish Signals from Trading Volume

If the intraday volume breaks support significantly higher than average, it indicates that there are a lot of investors selling at the same time, and the downtrend is likely to continue. Conversely, if the breakout volume is low, it may indicate that investor interest is not really high and that a trend reversal is likely.
A truly strong downtrend is always accompanied by increasing volume. When volume increases steadily during a downtrend, it indicates that there is a large outflow of money from the stock and that the trend is likely to continue.
Conversely, if a downtrend occurs without the support of volume, it may be a sign that the strength of the trend is weakening and a reversal is likely.
Conclusion
In conclusion, trading volume is very useful in technical analysis, right? Through today’s lesson, I hope you have a clear understanding of how they work and don’t forget to combine them with other indicators to increase your chances of success in investing!
See more:





