













Have you ever heard of “volume indicators“? What does volume mean in the market? What units do they measure? Does volume index affect market volatility? There are certainly many interesting aspects that we should grasp. Let’s find out the following useful information right away.
What are Volume Indicators?
The volume indicators are visualized as a measure of the strength of a trend. It shows how many people are buying or selling a currency pair.
When the volume is high, it means that a lot of people are interested in buying the currency pair, so the price tends to rise. Conversely, when the volume is low, it means that not many people are interested in buying or selling the currency pair. This can be a sign that the current trend is weakening or about to reverse.
When the price increases and the volume increases, it is a very positive signal. It shows that the uptrend is strengthening. However, if the price increases but the volume decreases, it can be a warning sign, indicating that buying power is weakening.
See now:
- Guide Step By Step How To Become A Successful Trader
- The 5 Best Momentum Indicators to Analyze Trend Strength
- Top 7 Best Volatility Indicators in the Market Updated 2024
How is volume measured?
The volume indicators are calculated based on the following formula:
Volume Indicator = Total number of shares or contracts traded during a specified period
Depending on the analysis period, the time frame can be of 1 or more trading sessions
The relationship between price and volume
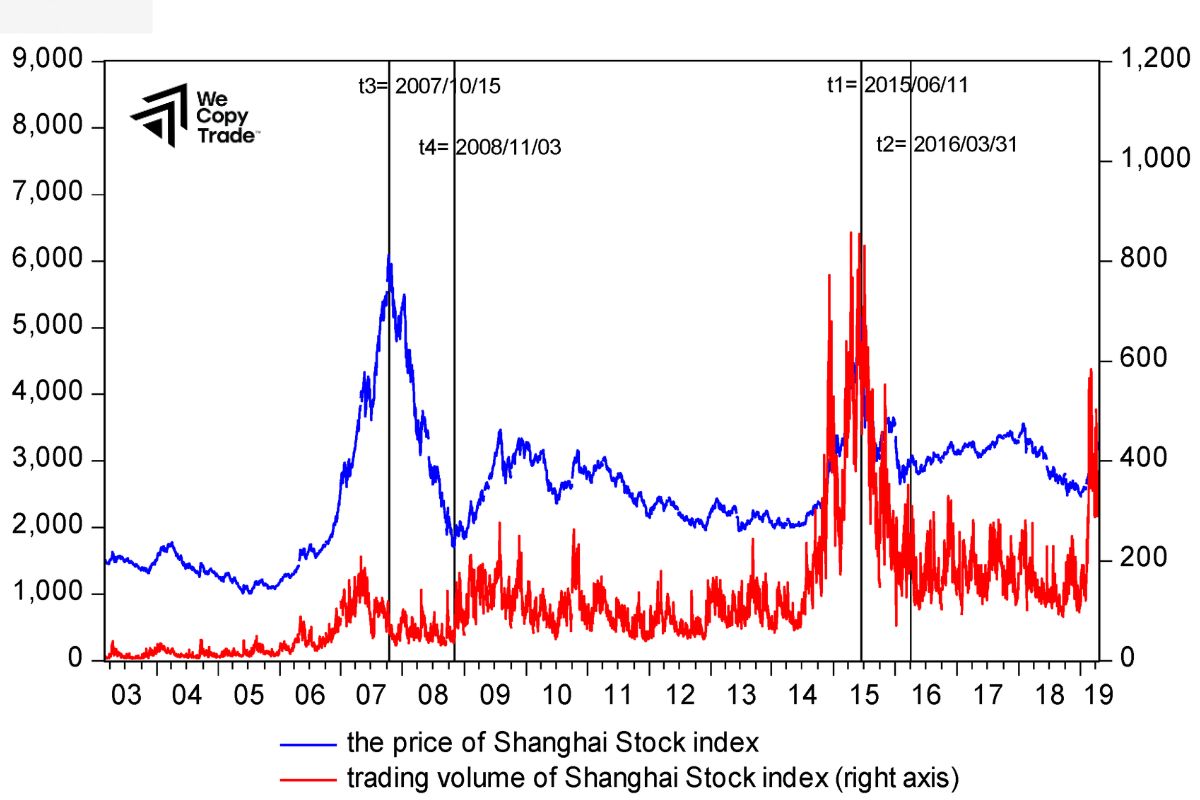
Price is the amount you pay to buy a stock or index. Closing prices are often used to gauge the performance of the market for a day.
The price-volume relationship shows the relationship between price movements and the number of shares traded. It helps us better understand the causes of price changes and predict future trends.
Basic Volume Indicators
On-Balance Volume (OBV)
OBV (On-Balance Volume) is a useful tool in technical analysis. It helps us better understand the strength of a trend by tracking the change in trading volume and its relationship with price.
Simple way to calculate OBV
- When the price increases: OBV will increase by the trading volume of that day.
- When the price decreases: OBV will decrease by the trading volume of that day.
- When the price remains unchanged: OBV will remain the same.
Advantages of OBV
- Simple and easy to understand: The calculation formula is quite simple and easy to apply.
- Reflecting market psychology: OBV helps us grasp investors’ emotions.
- Effective trend forecasting: OBV can provide early signals of market reversals.
Accumulation/Distribution Index (ADI)
The AD indicator can be simply understood as a scale. When the price closes in the upper half of the range, the scale tilts towards buying, causing the AD line to rise. Conversely, when the price closes in the lower half, the scale tilts towards selling, causing the AD line to fall. The AD line helps us better understand the balance between supply and demand in the market.
Accumulation/Distribution Formula:
MFM= ((Close−Low)−(High−Close)) / High−Low
Money Flow Index (MFI)

- The MFI (Money Flow Index) is a measure of the strength of money flowing into and out of a stock. It helps us better understand the buying and selling pressure that is acting on that stock. The MFI combines both price and volume to give a more comprehensive assessment than indicators based on price alone.
- How the MFI works:
- Calculating the typical price: First, we calculate the average of the highest price, lowest price, and closing price over a given period.
- Determining money flow: If today’s typical price is higher than yesterday, meaning there are more buyers, we have positive money flow. Conversely, if the typical price is lower, we have negative money flow.
- Calculating the MFI: We add up the positive and negative money flows over a given period, then compare them to calculate the MFI.
Volume Profile
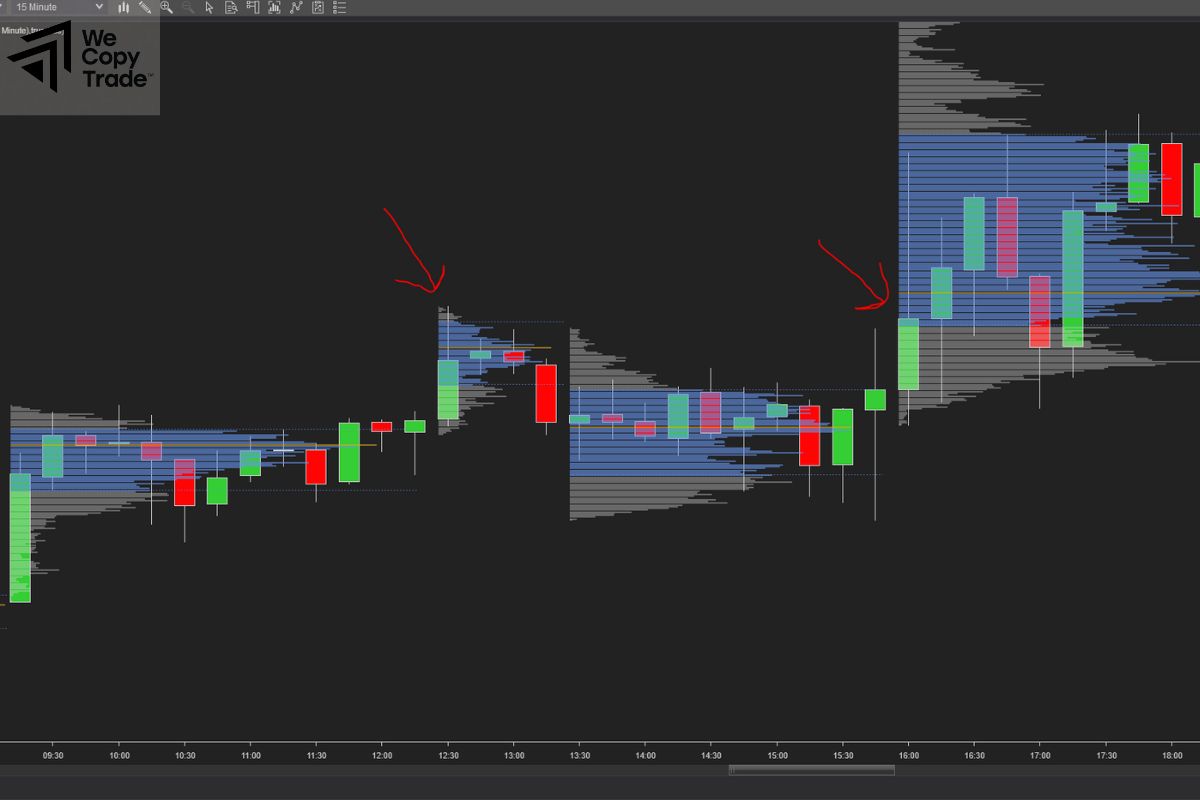
Volume Profile (VPVR) is a visual tool that helps us identify the price level where transactions are dense over a certain period of time.
- Important information VPVR provides:
- The price level that the market “prefers” the most.
- Where the price is most likely to trade and is most stable.
- VPVR helps identify price levels that the price often has difficulty breaking through, forming support and resistance zones.
- How to use VPVR:
- VPVR shows at each price level, investors tend to buy or sell more.
- When the price approaches the support or resistance zones identified by VPVR, it can be an opportunity to place a buy or sell order.
- If the volume is concentrated on one side of the chart, it can indicate a strong trend.
Volume Spread Analysis (VSA)
VSA (Volume and Range Analysis) is a technical analysis method that helps us better understand market action by looking at the relationship between trading volume and price movements.
VSA focuses on the following factors:

- Trading volume: shows how many people bought and sold an asset during a given period of time
- Price range: Is the distance between the highest and lowest prices in a trading session. A wide price range shows disagreement between buyers and sellers.
- Price patterns: VSA looks for specific price patterns combined with volume to predict future trends.
- Price and volume correlation: VSA looks at how price and volume move together. If price increases and volume increases, it shows that the trend is strong.
Combining Volume Indicators with Other Tools
Volume indicators are an extremely powerful analytical tool. However, when combined with other technical factors that complement different types of information, we can create a more complete picture of the market, thereby making more accurate investment decisions.
Conclusion
In conclusion, volume indicators are indispensable assistants in market analysis. With knowledge of volume indicators and how to combine them with other tools, you have equipped yourself with a powerful tool to conquer the market. Be confident and start your investment journey today!
See more:





