


Have you ever encountered a sudden price Reversal Patterns? Is this a trap set by big traders to trick beginners? These types of price fluctuations have made you lose confidence in the trading market, right? Don’t worry, let’s strengthen your confidence by learning the rules of the reversal candlestick pattern and answer all the questions right after today’s article!
What is a Reversal Pattern?
A reversal pattern is when a price that is rising or falling too quickly suddenly reverses its course. Simpler, a reversal is when the price trend of an asset changes direction. If the price is rising, a reversal will cause the price to start falling. Conversely, if the price is falling, a reversal will cause the price to start rising.
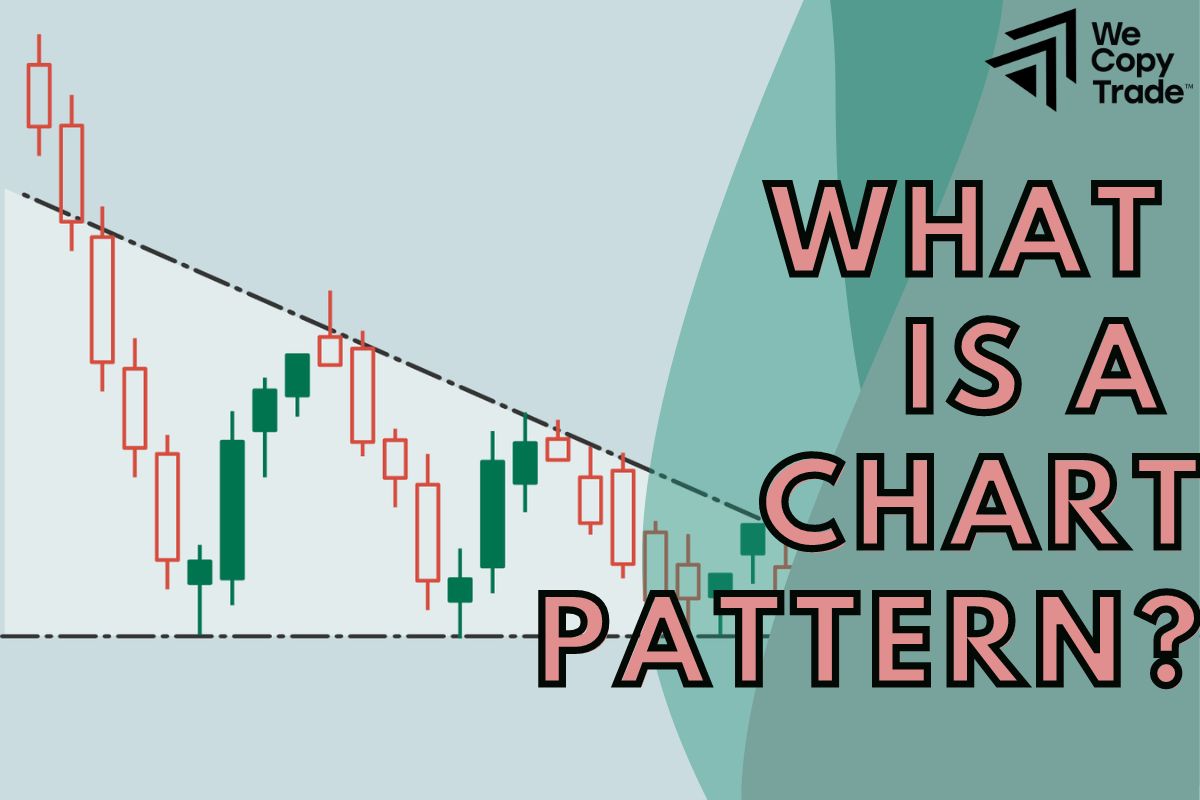
What is a Pattern charts?
Pattern charts are simply repeated patterns drawn based on price movements that have occurred in the market. The main idea behind creating this pattern is that based on the movements that have occurred in the past, it is possible to predict the movements that will occur next if that pattern repeats itself.
There are many different types of chart patterns, but they generally fall into three main categories:
- Reversal patterns: These patterns indicate a possible reversal of the current trend.
- Continuation patterns: These patterns indicate a continuation of the current trend.
- Divergence patterns: These patterns occur when price and a technical analysis move in opposite directions, signaling a change in trend.
In today’s article, we will learn about the reversal pattern group.
The significance of reversal patterns
Reversal Patterns are often seen as a lucrative investment opportunity for traders who know how to recognize the signals and take advantage of the moment to buy at the bottom and sell at the top. Knowing how these reversal signals work can also help you control your risk, help you get out of losing trades and protect your capital in time. Moreover, understanding reversals helps you build an effective trading strategy.
Types of candlestick reversal patterns
Steve Nison, one of the leading experts in Japanese candlestick technical analysis, introduced the Western world to some very effective reversal candlestick patterns trading. In his book “Japanese Candlestick Charting Techniques”, he emphasized the importance of the following candlestick patterns in predicting market reversals.
Engulfing Pattern
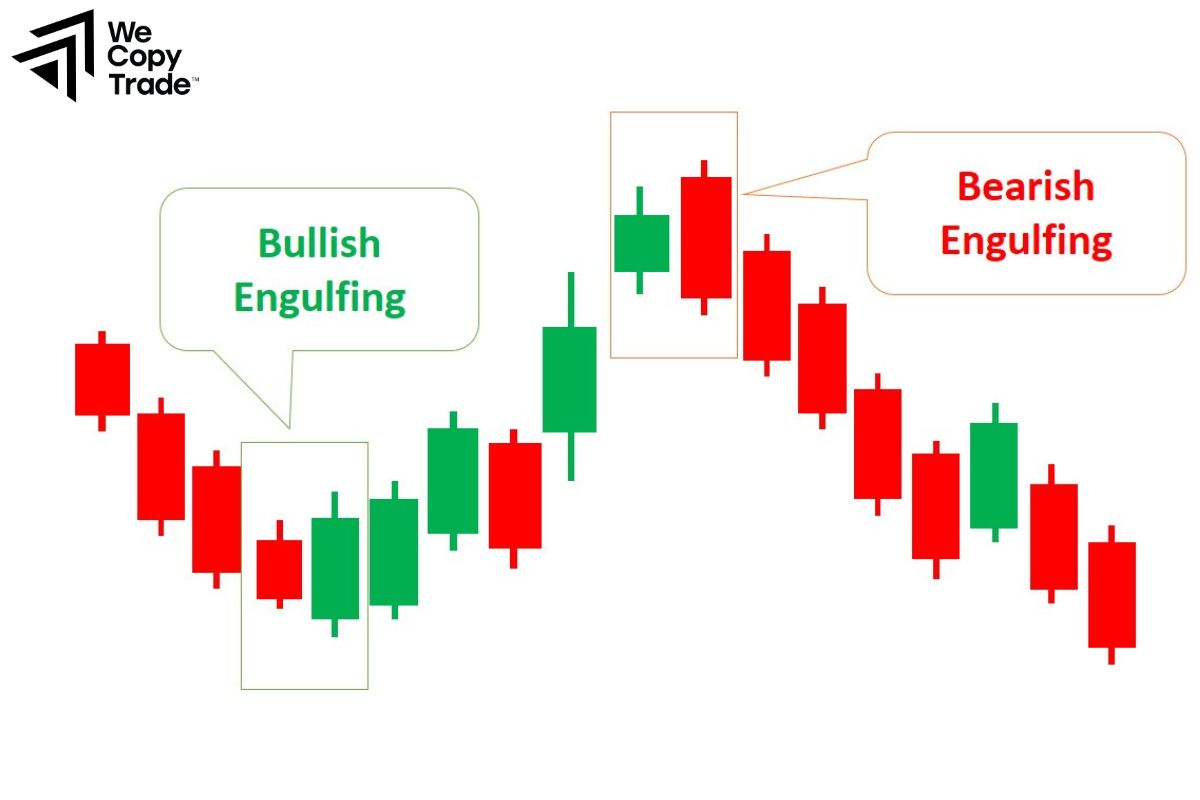
The engulfing pattern is one of the most popular reversal candlestick patterns. It consists of two consecutive candles and has two main types:
- Bearish Engulfing Pattern: Appears when the market is in an uptrend. The first candle is a green (bullish) candle, showing the market’s upward momentum. The second candle is a red (bearish) candle and completely “swallows” the previous green candle. This shows that the selling pressure has overwhelmed the buying pressure, signaling an impending bearish reversal.
- Bullish Engulfing Pattern: The opposite of the bearish engulfing Reversal Patterns, this pattern appears at the end of a downtrend. The first candle is a red (bearish) candle, showing the market’s downward momentum. The second candle is a green (bullish) candle, completely “swallowing” the previous red candle. This shows that buying pressure has overwhelmed selling pressure, signaling an imminent bullish reversal.
The engulfing pattern is one of the most reliable reversal signals in the market, indicating a significant shift in the balance between buying and selling pressure. This Reversal Patterns is easy to spot on the charts, even for novice traders.
Doji Pattern
Doji is a special type of candle on the chart, with a quite unique shape. The candle body is very short or even has no body, meaning that the opening price and closing price are almost equal. Therefore, Doji is often likened to a sign that the market is in a state of balance, the buying force and the selling force are struggling with each other.
Common types of Doji
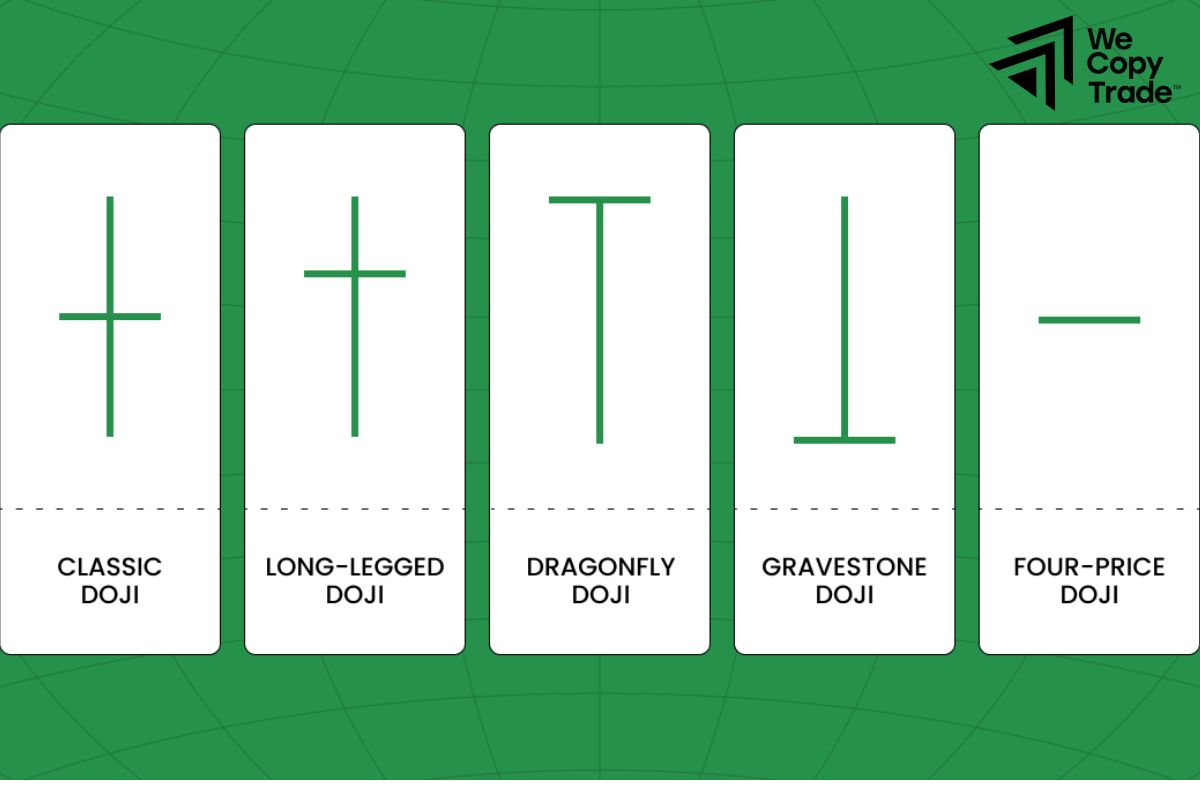
There are many different types of Doji, each with a different meaning:
- Star Doji: Has the shape of a star, often appearing at Reversal Patterns points.
- Dragonfly Doji: Has a long lower shadow, showing strong selling pressure at the beginning of the session but not strong enough to maintain until the end of the session.
- Gravestone Doji: In contrast to the dragonfly Doji, has a long upper shadow, showing strong buying pressure at the beginning of the session but not strong enough to maintain until the end of the session.
- Long-legged Doji: Has both long upper and lower shadows, showing strong price fluctuations during the session.
Dojis often appear when the market is uncertain about which direction to go. Dojis can signal an impending trend Reversal Patterns, especially when combined with other factors such as other candlestick patterns, technical analysis.
The “Abandoned Baby” Pattern
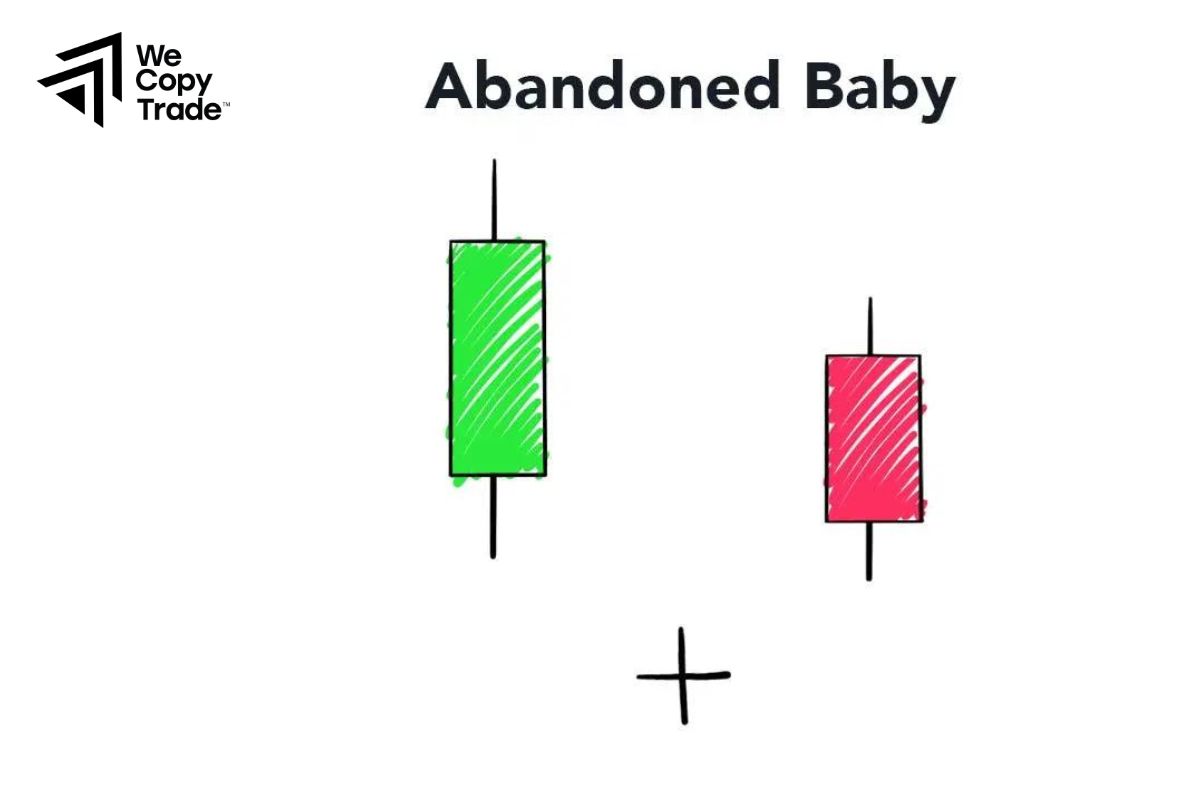
This is a strong reversal pattern, consisting of a Doji between two long candles. The first candle goes in the direction of the current trend, while the second candle goes against it. The middle Doji appears to be “abandoned” between these two candles, forming a clear reversal signal.
The Hammer Candlestick Pattern
The Hammer is a simple but important candlestick pattern that usually appears at the end of a downtrend and signals a potential reversal to the upside.
The body of the hammer is very short, indicating a balance between buying and selling pressure. The lower shadow of the hammer is very long, indicating that selling pressure was strong at the beginning of the session but was not strong enough to sustain until the end of the session. The closing price of the hammer is usually higher than the opening price, indicating that buying pressure prevailed at the end of the session.
Hanging Man Candlestick Pattern
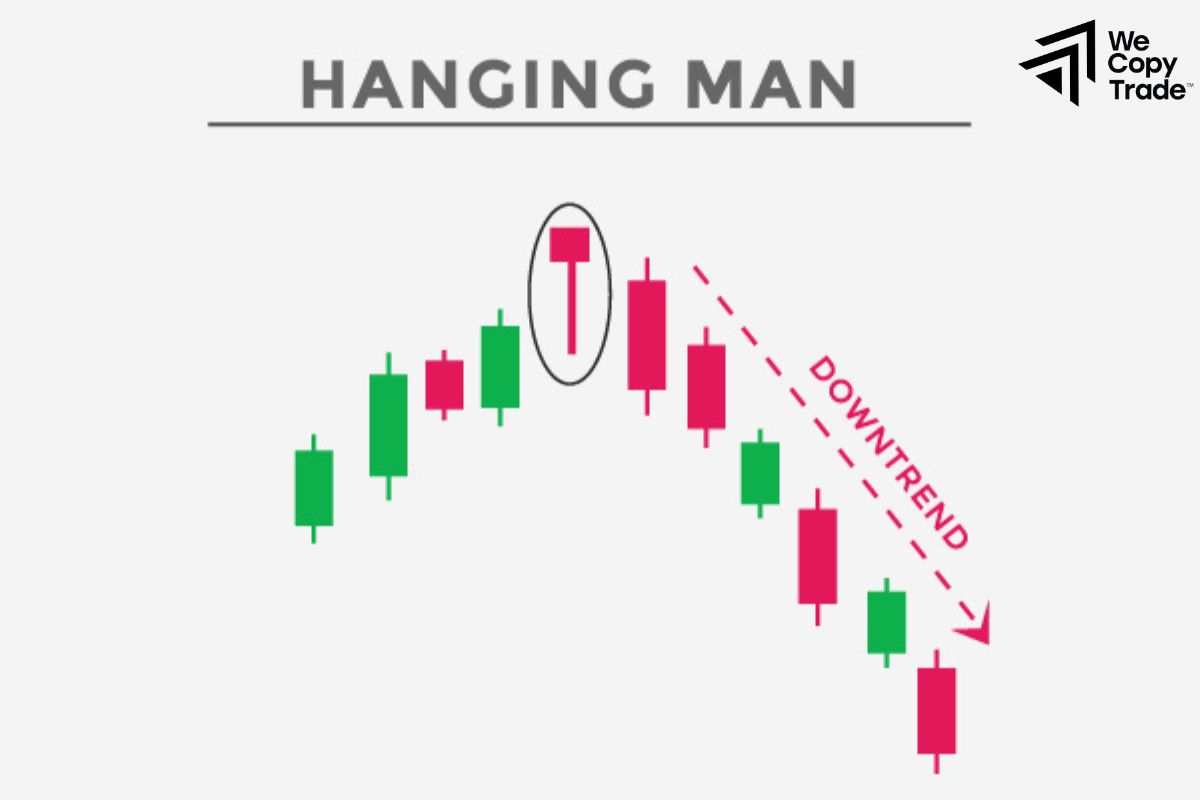
In contrast to the Hammer, the Hanging Man pattern is similar in shape to the Hammer but appears in an uptrend. It signals a potential reversal to the downside. The Hanging Man shows that selling pressure is increasing and could reverse the current uptrend.
Piercing Line candlestick pattern
A penetration consists of two candles: a long bearish candle and a long bullish candle. The long bullish candle “pierces” through the previous bearish candle, indicating that buying pressure was strong enough to overcome selling pressure and push prices up.
Harami Candlestick Pattern
The Harami candlestick Reversal Patterns is visualized as a mother candle enveloping a child candle next to it. In Japanese, “Harami” means “pregnant”, which is a fitting name to describe the shape of these two candles.
This pattern consists of two adjacent candles. The larger candle is called the “mother candle”, the smaller candle that is completely enclosed within the mother candle is called the “child candle”. The mother and child candles can be different colors, depending on the type of Harami.
Types of Harami Patterns
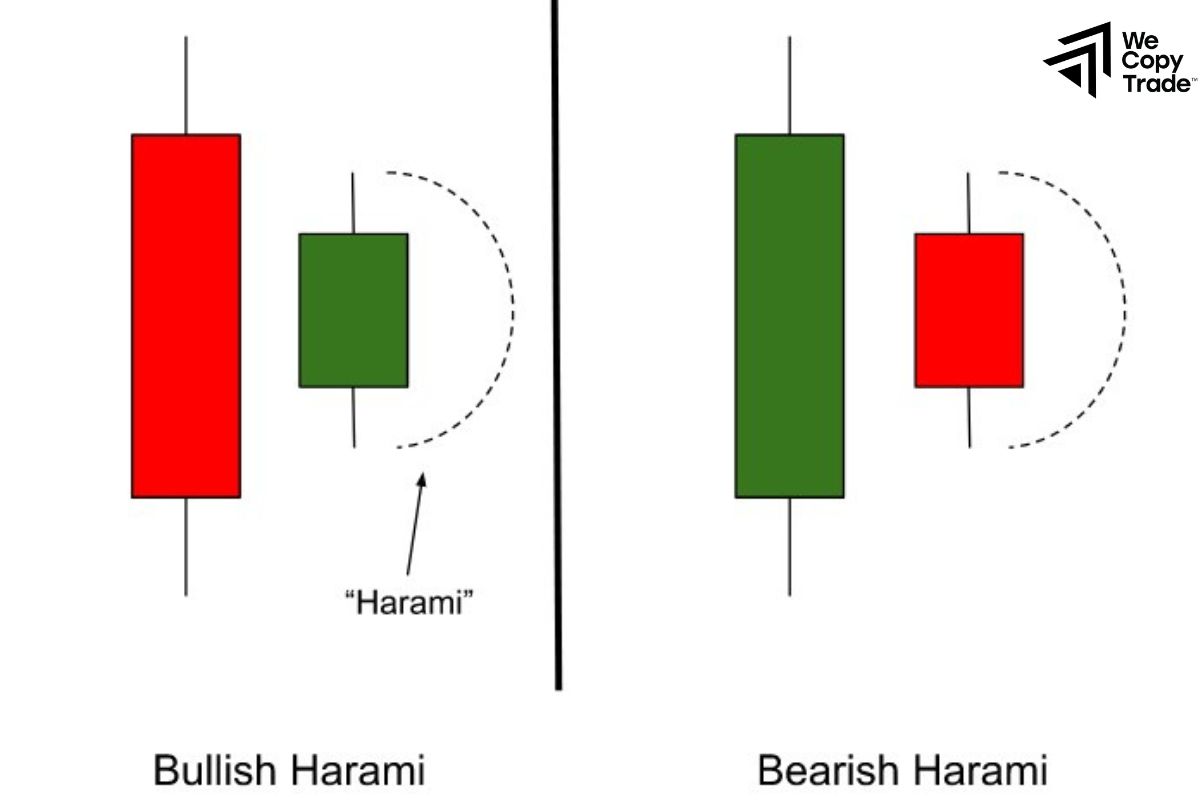
- Bullish Harami: Appears at the end of a downtrend, signaling a potential reversal to the upside. The mother candle is usually a red candle (bearish), the child candle is a green candle (bullish).
- Bearish Harami: Appears at the end of an uptrend, signaling a potential reversal to the downside. The mother candle is usually a green candle (bullish), the child candle is a red candle (bearish).
Harami shows investor indecision, buying and selling forces are balanced.
They are often seen as a potential reversal signal, but need to be confirmed by other factors.
Morning Star and Evening Star
The star pattern consists of three candles.
- Morning Star: Appears at the end of a downtrend, signaling a possible Reversal Patterns to the upside.
- Evening Star: Appears at the end of an uptrend, signaling a possible Reversal Patterns to the downside.
Conclusion
In conclusion, hopefully through the information about reversal patterns in the above article, you can make accurate decisions in trading to maximize profits and limit risks in time. Wish you success!

