












Do you know how the Industrial production index (IPI) affects the trading market? If you understand the rules of operation and know how to take advantage of these indicators, you will easily predict price changes and your path to success will also be shorter. Follow the following article, you will understand all the most important aspects of this indicator. Let’s go!
What Is the Industrial Production Index (IPI)?
The Industrial production index (IPI) is a number that tells us how efficiently a country’s factories and manufacturing plants are operating. Simply put, the IPI measures how “busy” these factories are compared to a year ago. It also tells us how much they can produce at full capacity and what percentage of that capacity they are using.
In the US, the Federal Reserve (FED) is responsible for publishing the Industrial production index. They usually publish this index in the middle of each month.
For example:
- An increase in the IPI means that factories are producing more, the economy is growing. Conversely, a decrease in the IPI means that factories are producing less, possibly due to reduced demand or other issues.
- A high capacity utilization rate shows that factories are operating at full capacity, the economy is busy. Conversely, a low capacity utilization rate indicates that factories are not operating at full capacity, either due to reduced demand or other problems.
See now:
- What is the Trade Balance? How to Calculate Balance Trading
- How Do Non-farm Payrolls Impact the Financial Market?
- How Do Unemployment Rates Impact To Market Vodility?
Advantages of IPI indicator
- Measuring the health of the economy: A high IPI shows that factories are producing more goods, which usually means that the economy is growing strongly. Conversely, a low IPI can signal a decline in manufacturing activity.
- Forecasting future trends: By tracking the IPI, economists and investors can predict the direction of the economy in the near future. For example, if the Industrial production index is consistently rising, they can predict that inflation may increase.
- Investment decisions: Investors use the IPI to decide where to invest. If the IPI is high, they may invest in manufacturing companies because they are likely to grow.
- Risk assessment: The IPI also helps investors assess the risk of their investments. If the IPI is falling, it means that the economy is struggling and your investments may be affected.
Calculating the IPI
The IPI is calculated by comparing the output of factories in the current month with the output of the same month in a base year. The base year serves as a benchmark for comparative analysis. Rather than telling us exactly how many tons of steel are produced, the IPI tells us what percentage of steel production has increased or decreased compared to the previous year.
To calculate the IPI, many different types of data are collected, from the amount of steel produced, the number of units sold (adjusted for inflation), to the number of hours worked by workers. All of this data is fed into a complex mathematical formula called the Fisher-ideal formula to calculate the final index. This formula helps ensure that the index accurately reflects changes in industrial production.
Seasonally adjusted
- To eliminate the effects of seasonal factors (for example, production often increases at the end of the year), IPI data are usually seasonally adjusted. This helps us see the overall trend of industrial production more clearly.
- Non Seasonally adjusted data shows the full effect of seasonal factors.
Sub-indices
In addition to the overall IPI, there are sub-indices for specific industries. This helps us understand the production situation of each industry better.
For example, there may be separate indices for the automobile manufacturing industry, the electronics manufacturing industry, the food industry, etc.
Formula to calculate IPI
IPI = (Current Output / Base Year Output) x 100
Current Output: The amount of goods or services that factories and enterprises produce during the period you want to calculate (for example, this month, this quarter).
Base year output: The amount of goods or services that factories and enterprises produce in the year chosen as a benchmark for comparison (for example, 2012).
For example: Suppose in 2012, a factory produced 100 cars. By 2023, this factory produced 120 cars. So the IPI of the automobile manufacturing industry in 2023 compared to 2012 will be:
IPI = (120 / 100) x 100 = 120
This means that automobile production has increased by 20% compared to 2012.
Calculation steps
- Select the base year: This is the year that we will compare with other years.
- Data collection: Collect data on the output of the industries that you want to calculate for both the base year and the current year.
- Apply the formula: Substitute the output values into the formula and calculate.
Comparing the Industrial Production Index (IPI) and Gross Domestic Product (GDP)
Both the IPI and GDP are important measures of economic activity, but they provide different perspectives.
Industrial Production Index (IPI)
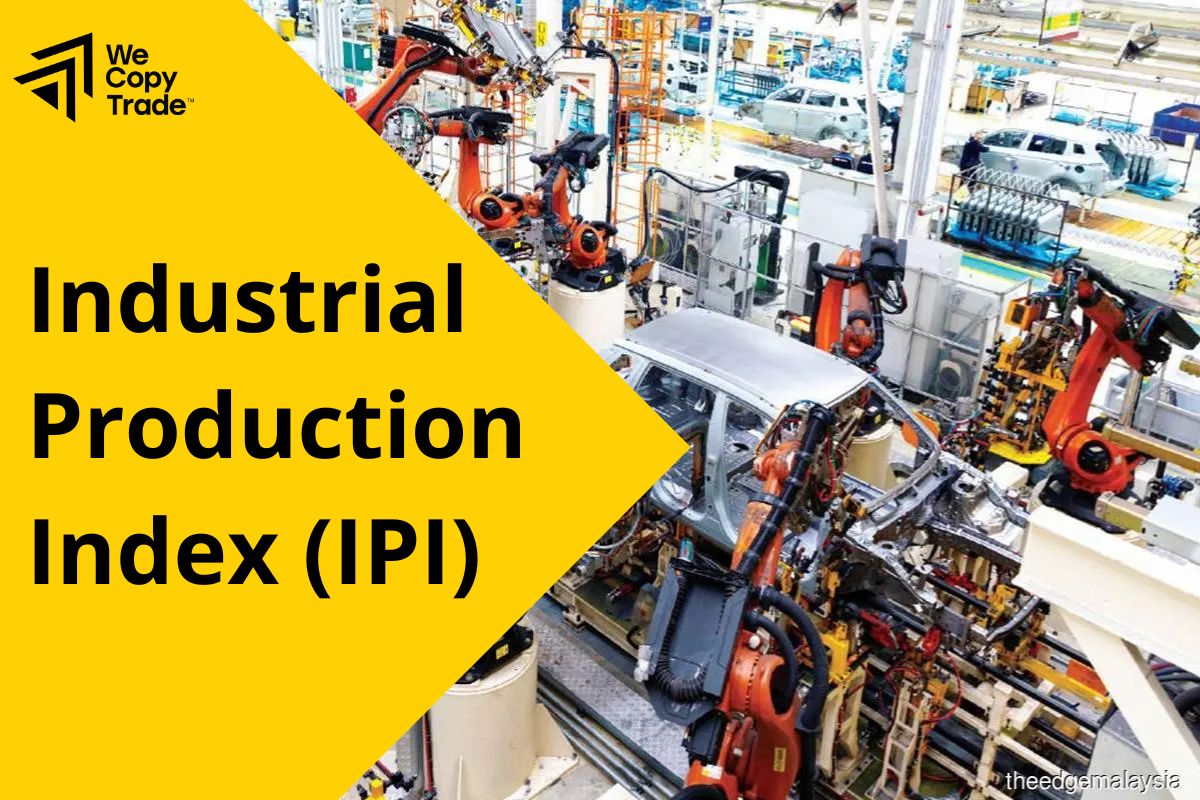
- The IPI focuses on measuring the production levels of industries such as manufacturing, mining, and utilities. It shows how efficiently factories and plants are operating.
- The IPI measures the quantity of goods produced, usually measured in physical units or factory output.
- The IPI is usually released monthly, providing an update on the production situation.
Gross Domestic Product (GDP)
- GDP is a measure of the total value of all final goods and services produced in a country during a given period.
- GDP includes not only industrial production but also agriculture, services, construction, etc.
- GDP measures the market value of goods and services, including value added at different stages of production.
- GDP is usually released quarterly.
Key Differences
- IPI focuses on a small part of the economy (industry), while GDP covers the entire economy.
- IPI typically measures physical output, while GDP measures market value.
- IPI is usually released monthly, while GDP is released quarterly.
For example, if a country increases its automobile production but decreases its agricultural production, Industrial production index may increase while GDP may not increase or increase more slowly, depending on the proportion of these two sectors in the economy.
Both IPI and GDP are important indicators for assessing the economic situation. However, to get a comprehensive view, we need to consider both indicators along with other economic indicators.
Conclusion
In conclusion, Industrial production index (IPI) is an important tool that helps us better understand a country’s manufacturing situation. By regularly monitoring and updating IPI, we can more accurately predict trends and make better investment decisions.
See more:





