












New traders are easily confused by false market signals. To become a successful trader, you first need to understand and identify these false breakouts signals. Learn how to recognize them now so you don’t get fooled!
What are false breakouts?
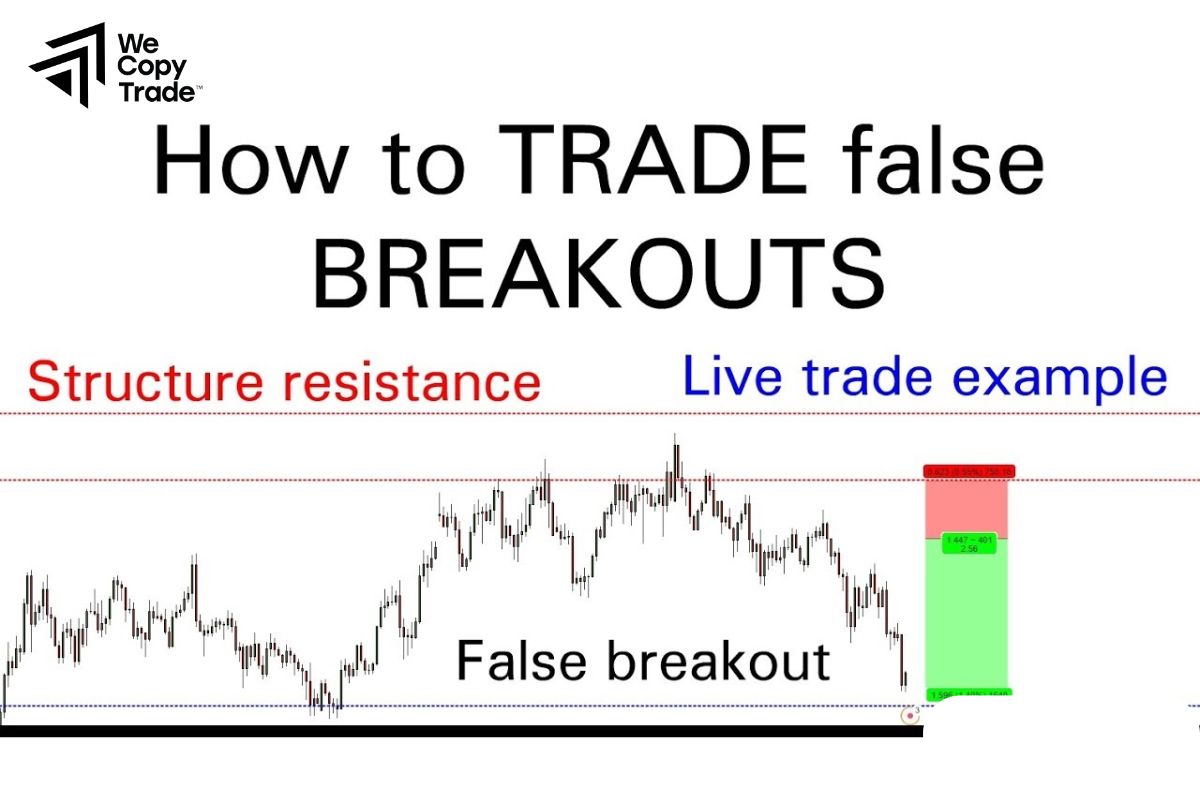
A false breakout can be defined as a trick played by the market. Initially, it appears that the price is breaking out of a support or resistance level, leading investors to believe that a new trend is about to begin. However, the price then reverses and moves against their expectations.
See more:
- What is Pullback? Effective Trading Methods You Should Know
- Basic types of fundamental analysis for effective investing
- The Importance of Macroeconomics in the Forex Market 2024
Breakout trading indicator
When trading breakouts, traders can use a variety of tools and methods. Here are three of the most common approaches:
Form analysis
Patterns such as triangles, rectangles, head and shoulders, double tops, etc. can provide signals about the start or end of a new trend. When the price breaks out of a pattern, it can signal that a new trend is forming.
For example, when the price breaks above an ascending triangle, it can be a buy signal.
Candlestick analysis
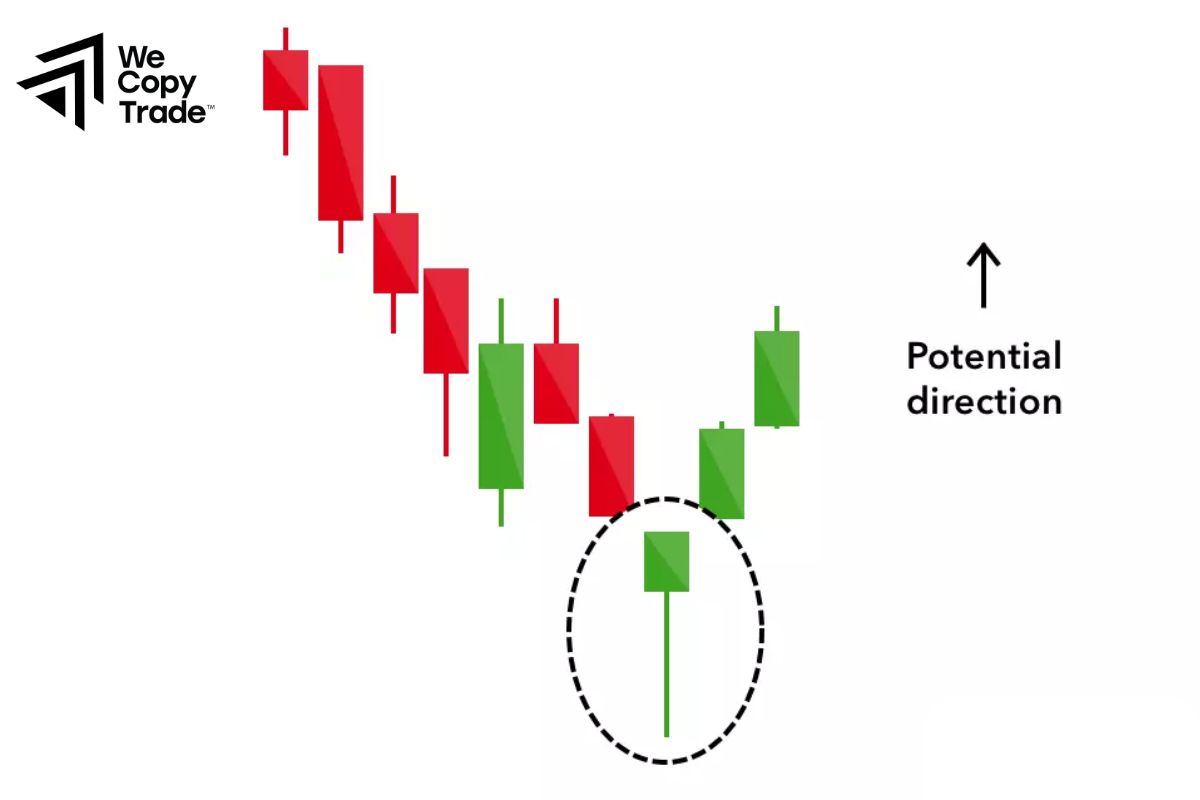
Candlestick patterns such as hammers, dojis, shooting stars, etc. can provide insights into market sentiment and the balance between supply and demand. Certain candlestick patterns can signal a trend reversal or continuation.
For example, a hammer candlestick that appears at the bottom of a downtrend can signal that the trend is reversing.
Technical Indicators
Technical indicators such as RSI, MACD, moving averages, etc. are used to gauge market conditions and identify potential buy or sell points. These indicators can help identify overbought, oversold areas, trends, and important crossovers.
For example, when the RSI exceeds 70, it can indicate that the market is overbought and a correction may be imminent
How to identify false breakout patterns
First, to be able to identify false alarms, let’s find out the main causes of this false alarm!
Why do false breakouts occur?

False breakouts are usually created by the manipulations of large investors. They create fake signals to attract small traders, then suddenly reverse the market to make a profit. The next reason is caused by liquidity. In financial markets, when liquidity is low, a small amount of money injected into the market can create very large price movements. This can lead to false breakouts. Next, over-reliance on technical indicators also contributes to the misunderstanding of price breakouts. Technical indicators only tell us what happened in the past, but cannot accurately predict the future. In addition, investing requires you to be patient. Some investors can easily fall into traps if they are too hasty in the face of unclear market signals.
How to recognize and take advantage of false breakouts
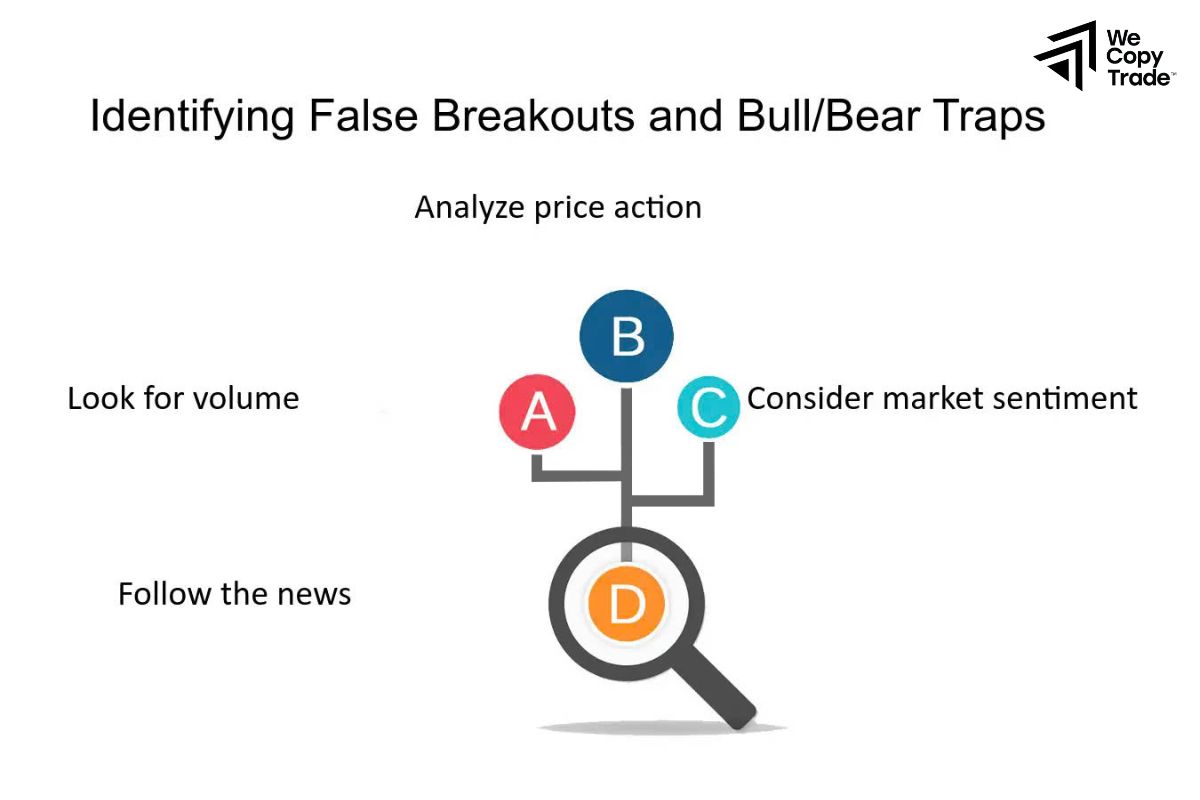
- Observe price action: Pay attention to reversal candles, unusual trading volumes and chart patterns that are characteristic of false breakouts.
- Use technical indicators: Some technical indicators can help you identify the possibility of a false breakout, but you should not rely too much on them.
- Practice and Training: Identifying false breakouts requires experience and regular practice. Look at the trading history of the currency pairs or stocks you are interested in to learn about common false breakout patterns.
Using Technical Analysis to Identify False Breakouts
Technical analysis is like a compass that helps us navigate the market. Using tools such as charts and indicators, we can identify signs that a breakout is really strong or just a trap.
- MACD indicator
The MACD is one of the most popular tools. When the MACD line crosses above the signal line, it is usually a buy signal. However, if the price then reverses and the MACD also reverses, it indicates that the initial buy signal may have been false.
- Trading volume
Trading volume is the most reliable measure of the accuracy of an alert. If a breakout is accompanied by high trading volume, it shows that many market participants agree with the new trend. Conversely, the possibility of a breakout being false is very high.
- Multi-timeframe analysis
By comparing daily, hourly, and even 15-minute charts, we can identify the larger trend and avoid short-term price fluctuations. If a breakout only appears on the short-term chart but is contrary to the long-term trend, the possibility of it being a “trap” is very high.
- Combine with fundamental analysis
In addition to technical analysis, it is also important to follow economic news and events. For example, if a company announces good business results but the stock price drops, it may indicate that there are other factors affecting the market.
How to avoid a false breakout
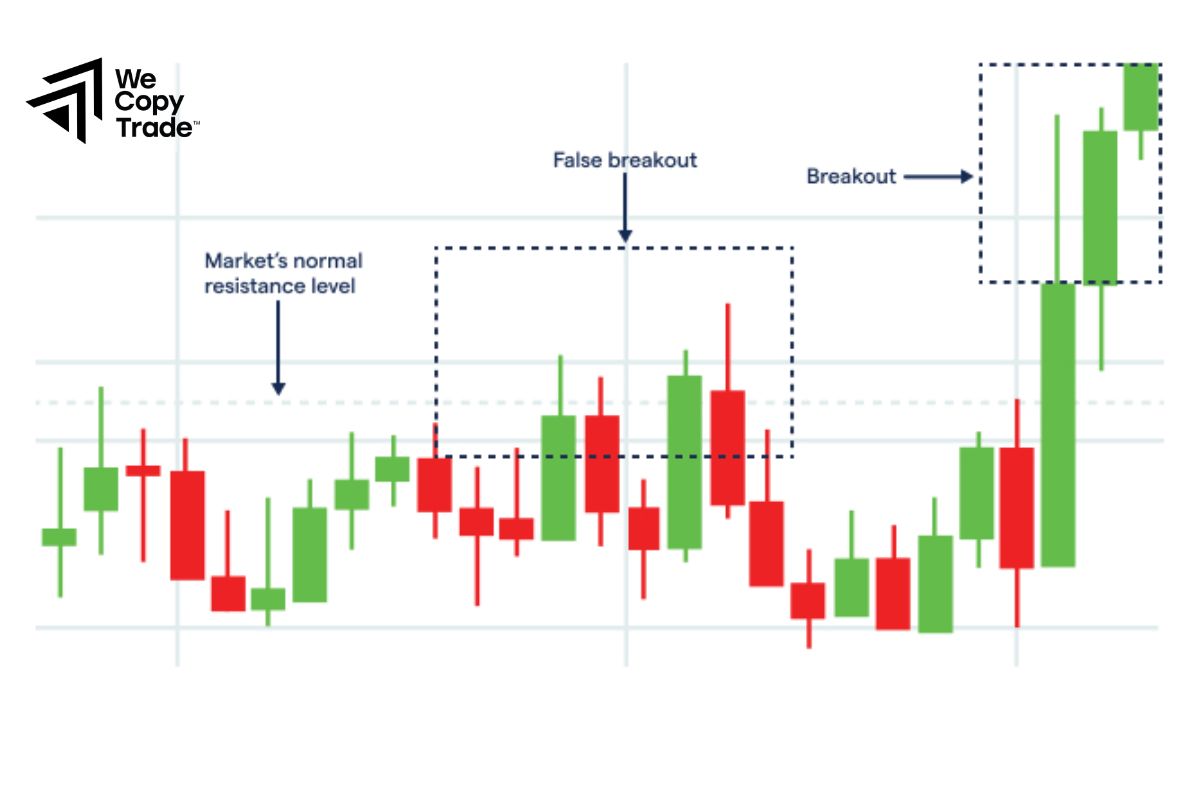
Have you ever felt like you found a great investment opportunity, only to see the price turn around and go in the opposite direction? It could be because you fell into a trap called a “false breakout”. So, to avoid falling into a false breakout trap, you should:
- Combine signals: There are many effective technical analysis tools. So you should not rely on just a few signals. Instead, consider different factors such as trading volume, news, and technical indicators.
- Set automatic stop orders: To minimize the risk of sudden changes in the market, you should set appropriate stop loss orders.
- Be patient: Do not rush into the trade, wait for clearer confirmation.
What to look for when trading false breakouts
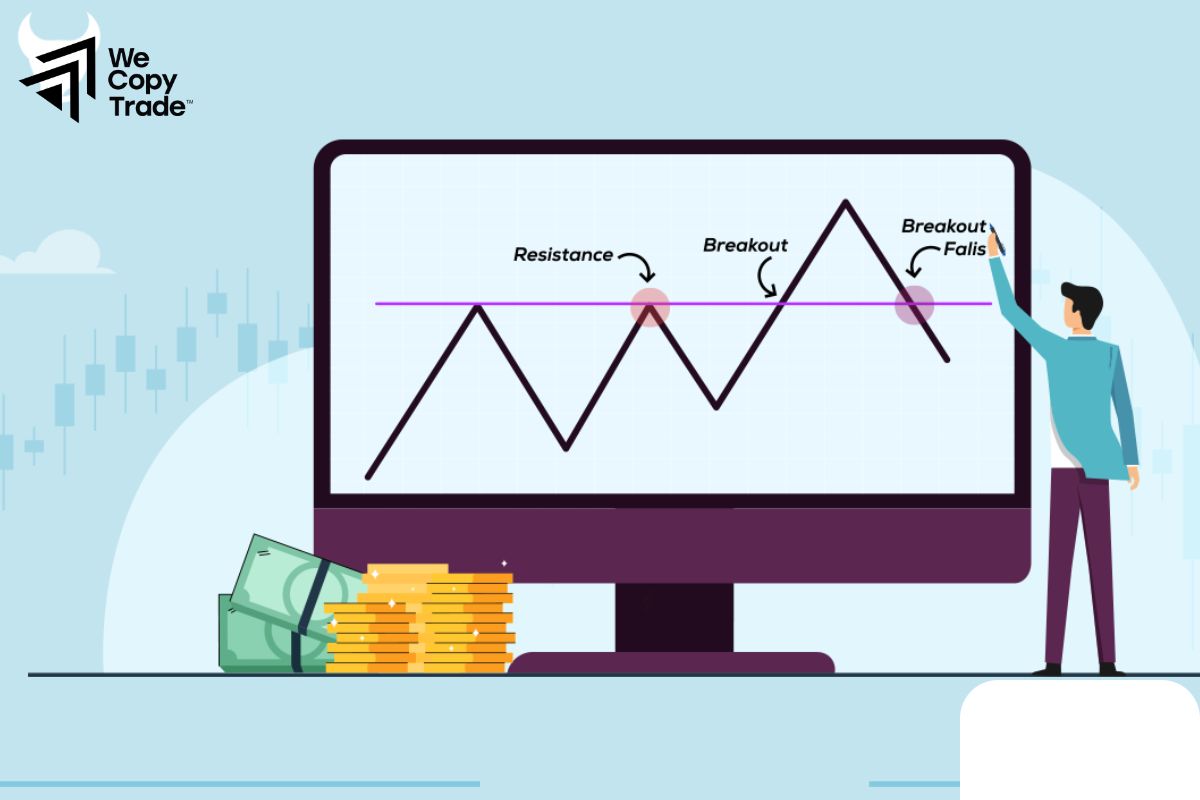
- First, look for key levels on the price chart. These levels are areas that provide a lot of liquidity to market participants.
- Avoid trading breakouts that occur in ranges or neutral trends because buyers and sellers are equally powerful during these times. In these situations, the potential for high volatility is very high, so we always recommend trading breakouts only in trending markets.
- Wait for the price to break above a key level in an uptrend or downtrend by closing the candle.
- After the breakout, wait for the price to test the breakout level by retracing to confirm the validity of the breakout.
Conclusion
In conclusion, once you understand false breakouts, you can avoid making wrong trading decisions and protect your capital. Take advantage of breakouts to create attractive trading opportunities for yourself!
See now:





