


Pullbacks are a common phenomenon in financial markets, providing traders and investors with a brief pause in a strong trend. Therefore, understanding how to recognize and react to retracements is important to maximize profits and minimize risks in active trading. Check it out now!
What is Pullback in Forex?
In Forex trading, a pullback refers to a temporary reversal or decline in the price of a currency pair during a prevailing trend. This is typically a short-term dip in price before the trend resumes its original direction, whether upward or downward.

For instance, in an upward trend, a pullback would be a brief drop in the price of the currency pair, while in a downward trend, it would be a temporary price rise. Pullbacks are often seen as opportunities for traders to enter trades at better prices within the overall trend. It is important to distinguish pullbacks from reversals, as pullbacks are short-lived, while reversals indicate a complete change in the trend’s direction.
So, in Forex, recognizing pullbacks helps traders plan their entries and exits effectively, improving risk management and profit potential.
See more:
- Basic types of fundamental analysis for effective investing
- The Importance of Macroeconomics in the Forex Market 2024
5 types of pullbacks in trading
In trading, there are several popular types of pullbacks that traders often encounter and analyze to identify potential trading opportunities. Here are some of the most common types:

Shallow Pullbacks
- A shallow pullback involves a small, brief price retracement, typically less than 38.2% of the original movie. This type of pullback indicates strong market momentum in the direction of the trend, and traders often use it to enter trades early in the trend continuation.
Deep Pullback
- A deep pullback retraces a significant portion of the previous move, often between 50% and 61.8%, based on Fibonacci retracement levels. Traders look for deep pullbacks to enter the market at a discounted price, though it may carry higher risk as it could signal weakening trend momentum.
Steady Pullback
- A steady pullback is characterized by gradual, consistent price declines or rises over time. These pullbacks often form clear, predictable patterns, such as channels or flags, and provide clear entry points for traders looking for trend continuation.
Sharp Pullback

- A sharp pullback features a fast and steep price movement against the prevailing trend. It often shakes out weaker hands but can present an opportunity for experienced traders to enter trades at more advantageous prices once the pullback stabilizes.
Volatile Pullback
- Volatile pullbacks occur in highly fluctuating markets where prices move erratically, creating sharp rises and falls. These pullbacks make it more challenging to predict price behavior and require careful risk management for those looking to trade them.
How to trade Pullback with investors most effectively
To trade pullbacks effectively with investors, it’s essential to have a clear strategy, understand market dynamics, and use technical tools that help identify low-risk, high-reward opportunities. Here are some steps and techniques to trade pullbacks successfully:

Identify the Main Trend
Before trading a pullback, ensure you are trading in the direction of the main trend. In an uptrend, you’re looking for opportunities to buy during the pullback, while in a downtrend, you’re seeking selling opportunities. Trendlines, moving averages, and higher highs/higher lows (uptrend) or lower highs/lower lows (downtrend) can help confirm the trend.
Use Fibonacci Retracement Levels
Fibonacci retracement tools are useful for identifying where a pullback might end. The 38.2%, 50%, and 61.8% levels are the most commonly watched by investors. If the price pulls back to one of these levels and shows signs of bouncing, it could be a good entry point to trade in the direction of the trend.
Combine with Moving Averages
Moving averages can serve as dynamic support or resistance during a pullback. If the price pulls back to a key moving average, such as the 20-day or 50-day, and holds that level, it may signal a strong entry point. Use this in conjunction with other tools like Fibonacci or trendlines.
Look for Divergence in RSI or MACD

Check for divergence between price action and momentum indicators like the Relative Strength Index (RSI) or Moving Average Convergence Divergence (MACD). If the price pulls back while these indicators show weakening momentum (e.g., higher lows in the RSI during a pullback in an uptrend), it can signal a trend continuation.
Entry on Breakout of Pullback
After the pullback stabilizes, many traders wait for a breakout above the short-term resistance level formed during the pullback (in an uptrend) or a breakdown below short-term support (in a downtrend). This breakout often confirms that the trend is resuming, providing a clearer entry point.
Set Stop Loss Below the Pullback
To manage risk, always place a stop-loss just below the lowest point of the pullback in an uptrend or above the highest point in a downtrend. This ensures you limit losses in case the pullback turns into a trend reversal.
Determine Risk-Reward Ratio
Calculate a favorable risk-reward ratio before entering a trade. A common ratio is 1:3, where potential gains should be at least three times greater than the potential loss. This helps ensure that, over time, profits outweigh losses even if not every trade is successful.
Advantages and disadvantages of trading with pullbacks
Advantages of trading with pullbacks include better entry prices and reduced risk by buying at discounted levels within a trend. Disadvantages are the potential for pullbacks to turn into trend reversals and the difficulty in accurately timing entries.
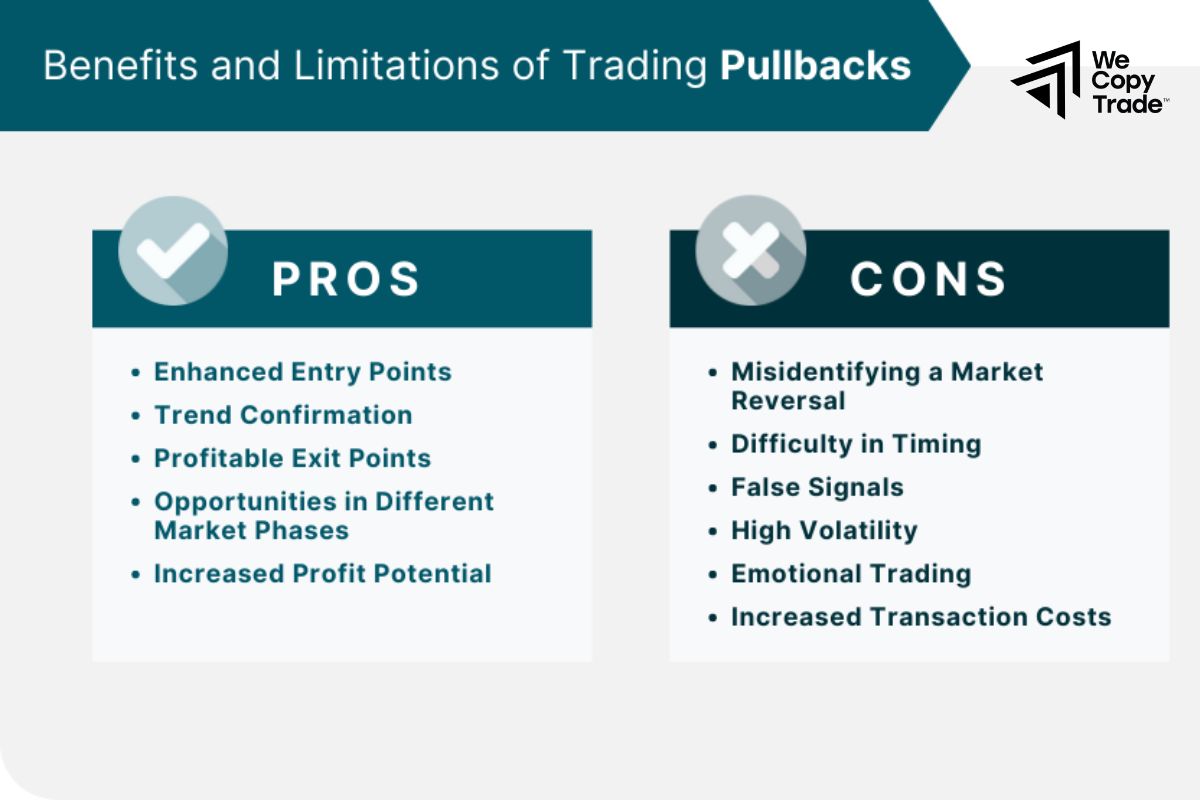
Advantages of Trading with Pullbacks:
- Pullbacks offer opportunities to enter trades at more favorable prices within a strong trend.
- By entering after a temporary retracement, traders can set tighter stop-loss levels, minimizing potential losses.
- Trading in the direction of the trend increases the chance of capturing bigger price movements.
- Pullbacks provide confirmation that the trend is still intact, reducing the likelihood of entering a trade during a reversal.
- Tools like Fibonacci levels, moving averages, and trendlines make it easier to spot pullbacks and determine when to enter a trade.
Disadvantages of Trading with Pullbacks:
- Pullbacks can sometimes turn into full trend reversals, leading to potential losses if not managed properly.
- Waiting for a pullback may cause traders to miss out on strong momentum moves, reducing profit potential.
- Pullbacks can sometimes be misleading, especially in volatile markets, leading to false breakouts or entries.
- It can be challenging to determine the exact end of a pullback, leading to poor entries or early exits.
- Trading pullbacks often requires waiting for the market to retrace, which can be frustrating and lead to missed opportunities if the trend doesn’t pull back as expected.
Comparing Pullbacks and Throwbacks

Here’s a table comparing pullbacks and throwbacks:
| Aspect | Pullbacks | Throwbacks |
| Definition | Temporary decline in price during an uptrend | Temporary rise in price during a downtrend |
| Direction | Occurs in an uptrend | Occurs in a downtrend |
| Purpose | Provides buying opportunities at better prices | Confirms broken support now acting as resistance, offering short opportunities |
| Indicators | Fibonacci retracement levels, trendlines, moving averages | Support and resistance levels, trendline breakouts |
| Entry Strategy | Buy during the retracement with expectation of trend resumption | Sell during the retracement with expectation of trend continuation |
| Trend Confirmation | Confirms that the uptrend is still intact | Confirms that the downtrend is likely to continue |
Popular indicators to use when trading Pullbacks
When trading pullbacks, several popular indicators can help identify entry points and confirm the trend. Here are some commonly used indicators:
Fibonacci Retracement Levels
- Identifies potential support and resistance levels where the price may reverse during a pullback.
- Draw Fibonacci retracement lines from the recent low to high (in an uptrend) or high to low (in a downtrend) to find key levels (38.2%, 50%, 61.8%).
Moving Averages (MA)
- Provides dynamic support or resistance levels and confirms trend direction.
- Watch for price interactions with moving averages like the 20-day or 50-day SMA. A pullback to these levels can offer entry points.
Relative Strength Index (RSI)
- Measures the speed and change of price movements to identify overbought or oversold conditions.
- In an uptrend, look for RSI moving from overbought levels during a pullback, indicating a possible buying opportunity.
Moving Average Convergence Divergence (MACD)
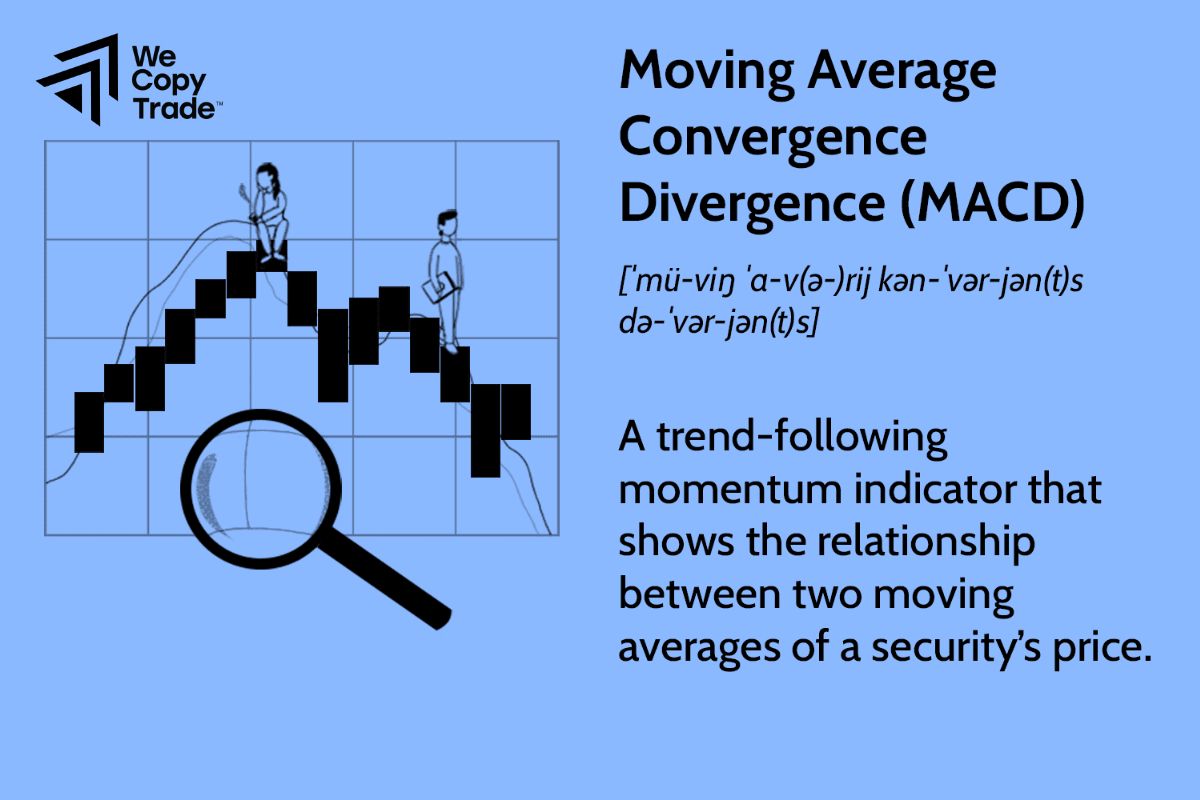
- Shows the relationship between two moving averages of an asset’s price to identify trend direction and momentum.
- Look for MACD line crossing above the signal line during a pullback to confirm a resumption of the uptrend.
Bollinger Bands
- Measures volatility and provides levels where the price may revert to the mean.
- A pullback often reaches the lower Bollinger Band (in an uptrend) or upper band (in a downtrend), suggesting a potential reversal.
Trendlines
- Provides visual guidance on the direction of the trend and potential reversal points.
- A pullback that touches a trendline and then resumes the trend can confirm the trend’s strength.
Conclusion
In conclusion, mastering the art of trading can significantly enhance your trading strategy by offering opportunities to enter the market at more advantageous prices within a prevailing trend. Whether you are a seasoned trader or just starting, understanding and applying pullback strategies can lead to more informed and profitable trading decisions. Start incorporating analysis into your trading routine today and take your trading game to the next level!
See now:

