













The market is a place where there are always many fluctuations. When we can predict the market trend and have a careful trend trading campaign, our chances of successful trading are higher. Don’t miss the following article, I will guide you through the secrets to increase the chances of success when trading with the trend.
What Is Trend Trading?
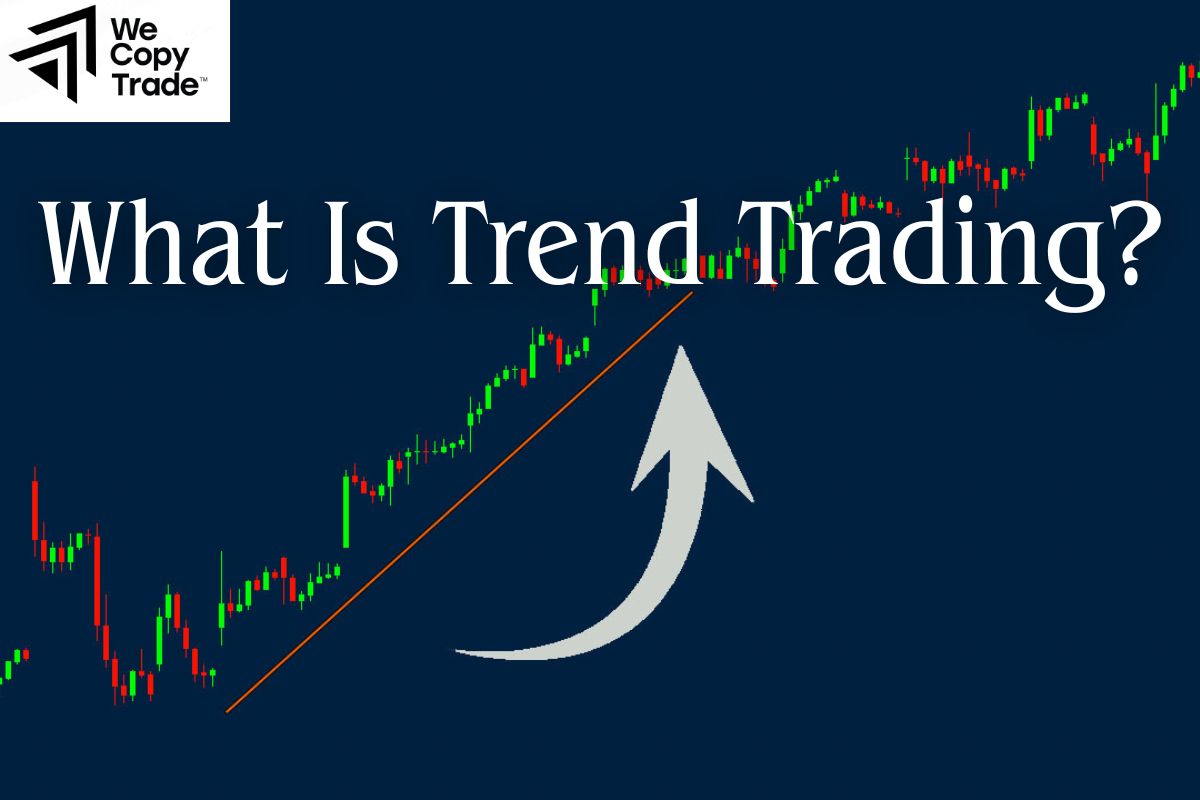
Trend trading is a way of investing that involves observing the price of an asset moving in a certain direction over a period of time. In other words, investors try to profit by “going with” the market’s uptrend or downtrend.
An uptrend is when the price of an asset is consistently rising, forming a series of higher highs and higher lows. Conversely, a downtrend is when the price is steadily falling, forming a series of lower highs and lower lows.
Trend traders will buy when they see an uptrend forming, and sell when they see a downtrend forming. They use technical tools such as moving averages, trend lines, and other technical indicators to better identify the trend and find ideal buy/sell points.
For example:
- If a company’s stock price has been rising for several months, it is a sign that an uptrend is forming. A trend trader may decide to buy this stock in the hope that the price will continue to rise.
- Conversely, if the price of gold continues to fall for a long period of time, it is a sign that a downtrend is underway. A trend trader may decide to sell gold or buy a futures contract to sell gold in the future in the hope that the price will fall further.
See more:
- How To Identify Entry and Exit Points in Stock Market
- Guide How To Use The Hybrid Trading Strategy In a Right Way
- What is Manual Trading? Characteristics of Manual Traders
Pros and Cons of Trend Trading
Trend trading is considered a smart way to invest to maximize opportunities in the market. However, besides those advantages, there are also some limitations that you need to note. Let’s find out right away:
Pros of Trend Trading
- When the market is in a clear trend (up or down), following the trend will help you double your profits. You will have the opportunity to earn significant profits from strong price fluctuations.
- You don’t need to be a financial expert to start trend trading. Just master the basic concepts and choose the right supporting tools, you can confidently apply this strategy.
- Whether you are interested in stocks, gold, foreign currencies or any other asset, trend trading can be applied flexibly. This helps you diversify your portfolio and minimize risks.
Cons of Trend Trading
Although it is a popular and effective investment strategy, it is not always perfect. Before investing, it’s important to understand the following limitations:
- When relying on trends, investors often enter orders after the trend has clearly started. This means that you may miss out on some of the initial profits.
- Not everything you see is the real trend. Many times, the market creates false signals, confusing investors and causing them to make wrong decisions.
- When prices fluctuate around a certain level, also known as a sideways market, without a clear trend, the trend trading strategy will become less effective.
Top Common Indicators Applied for Trend Trading
To make the most of trend trading, here are the 4 most commonly used technical indicators:
Moving Average – MA
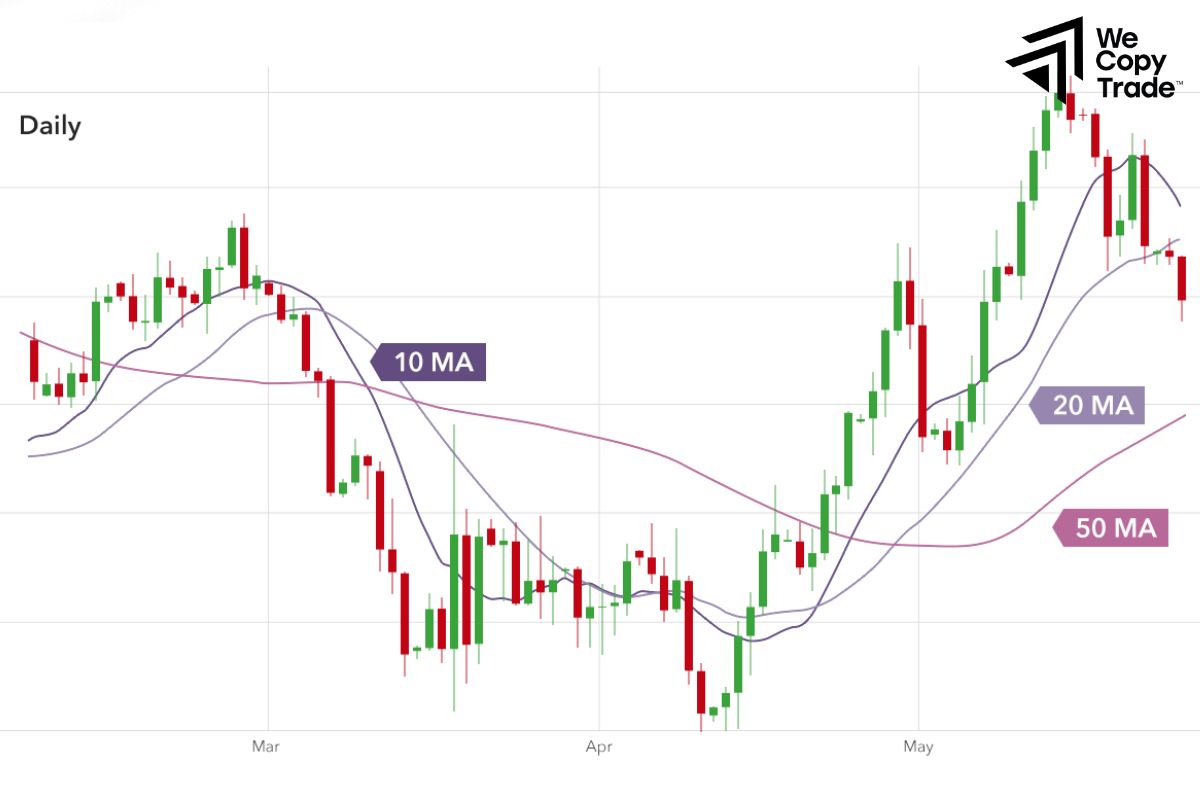
Moving average is a widely used technical analysis tool to smooth price data, helping investors easily identify market trends. In other words, the MA line draws a straight line on the chart, showing the average price of an asset over a certain period of time, helping investors quickly determine whether the market is going up, down or sideways. Moreover, MA lines often act as important support or resistance levels, helping investors make accurate buying and selling decisions.
How to use moving averages:
If the MA line is going up, the market is trending up. Conversely, if the MA line is going down, the market is trending down.
When two MA lines with different periods intersect, it can be a buy or sell signal. For example, when the short-term MA crosses above the long-term MA, it can be a buy signal.
When the price touches the MA, it can bounce back (if the MA acts as support) or slow down (if the MA acts as resistance).
There is also a special variant of the MA called MACD. MACD is a technical indicator that helps investors determine the strength and direction of a trend. The buy signal is when the MACD line turns from negative to positive and crosses the signal line from bottom to top. Conversely, the sell signal is when the MACD line turns from positive to negative and crosses the signal line from top to bottom.
Relative Strength Index (RSI)
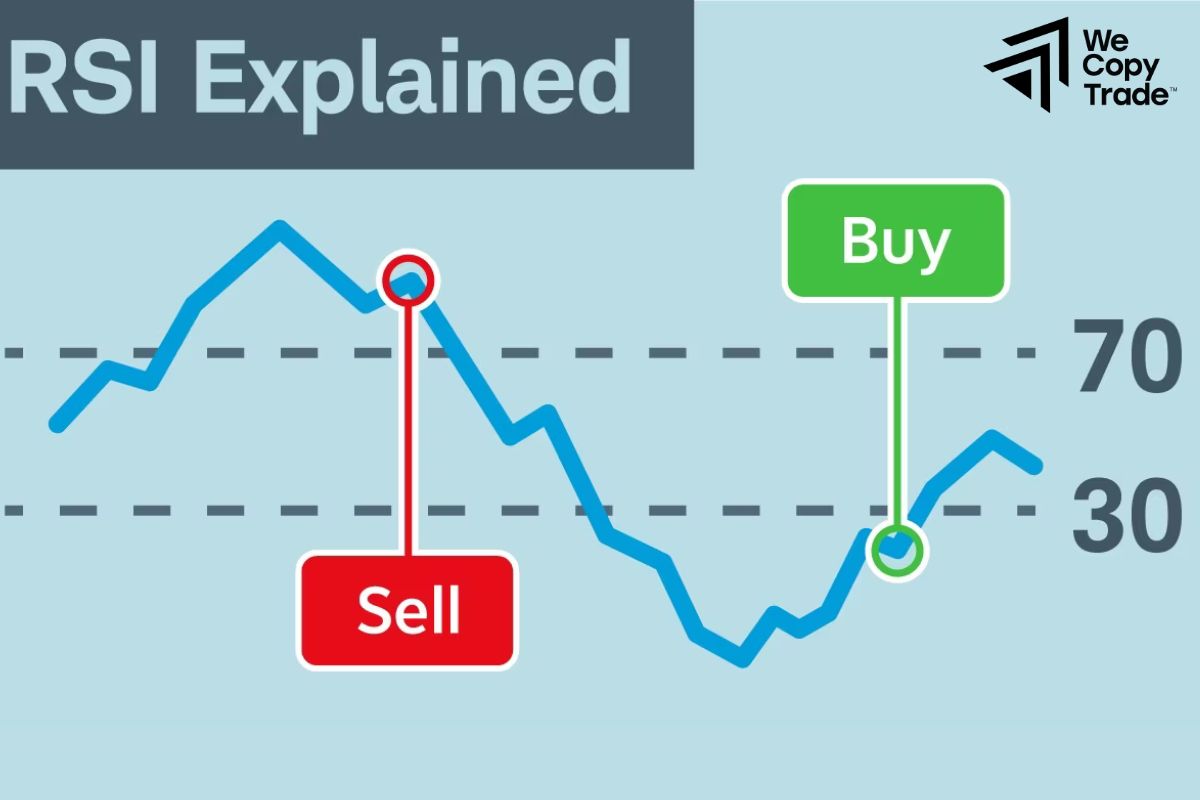
RSI is a widely used technical analysis tool that measures the speed and change of price movements over a certain period of time. RSI fluctuates between 0 and 100, helping investors assess whether the market is overbought or oversold.
When RSI exceeds 70, this indicates that the market is overbought, meaning that the price has increased too quickly and may be about to correct.
On the contrary, when RSI falls below 30, this indicates that the market is oversold, meaning that the price has decreased too strongly and may be about to recover.
Application of RSI in trading:
When RSI rises from the oversold zone (below 30) to above 50, it may be a buy signal.
Conversely, when RSI falls from overbought territory (above 70) to below 50, it could be a sell signal.
Also, if RSI moves in the same direction as the trend, it indicates that the trend is strong. On the other hand, divergence between RSI and price could be a warning signal of a trend reversal.
On Balance Volume (OBV)
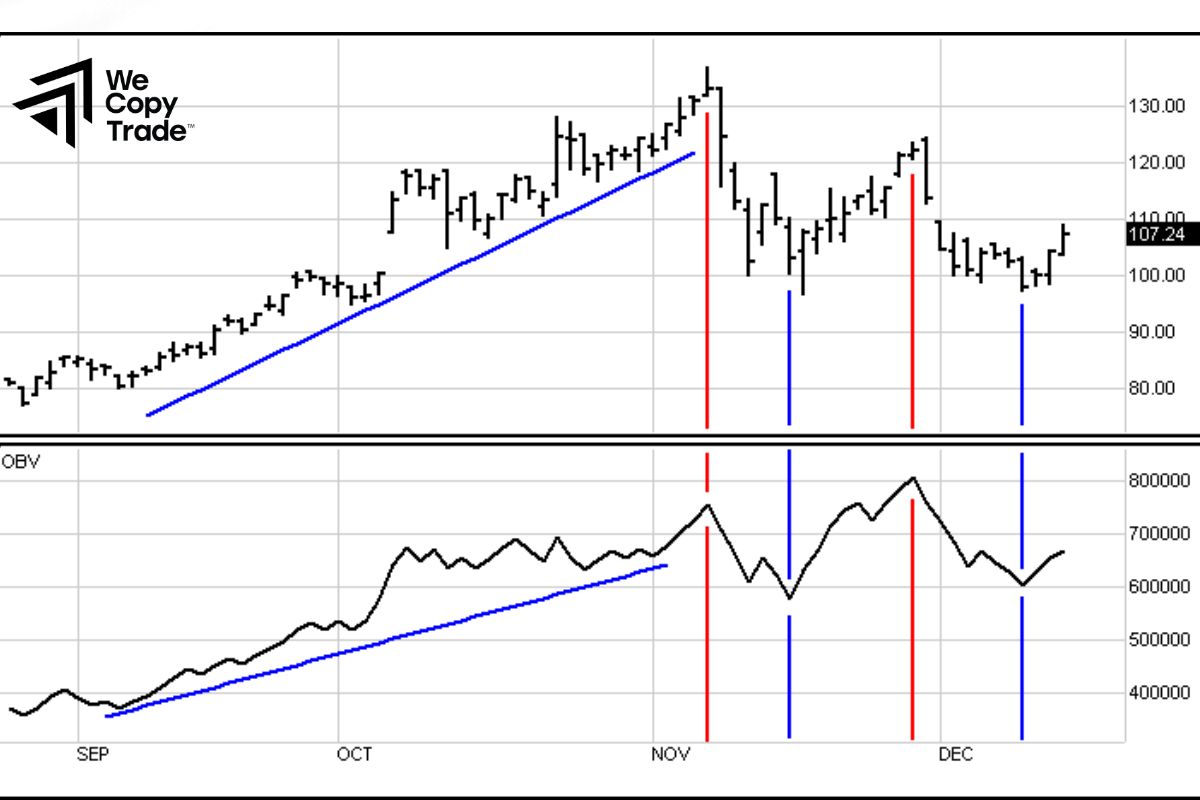
OBV is a technical analysis tool used to measure the relative strength of buyers and sellers in the market.
OBV is calculated by adding the trading volume on days when the closing price is higher than the previous day and subtracting the trading volume on days when the closing price is lower than the previous day. The OBV line will increase when volume is positive (price increases) and decrease when volume is negative (price decreases).
When price and OBV move in the same direction, it shows that the current trend is strong and likely to continue. If price and OBV move in opposite directions, it can be a warning signal of a trend reversal.
OBV application in trading:
When OBV makes a new high while price is correcting, it can be a buy signal. Conversely, when OBV makes a new low while price is rallying, it can be a sell signal.
When price breaks out of an important resistance or support level, a sharp increase in OBV confirms the strength of the breakout.
Conclusion
In conclusion, trend trading is an attractive investment strategy. As with any investment, there’s always a degree of risk involved. To be successful, you need to combine it with other analytical tools and always be ready to adapt to market changes.
See now:





