













All the results that lead to your trading success depend on how you place your orders. So do you know how to identify entry and exit points in Stock market effectively? It’s really not as difficult as you often hear rumors. Don’t miss the following article, I will share with you all the secrets and experiences that I have.
What are Entry Points?
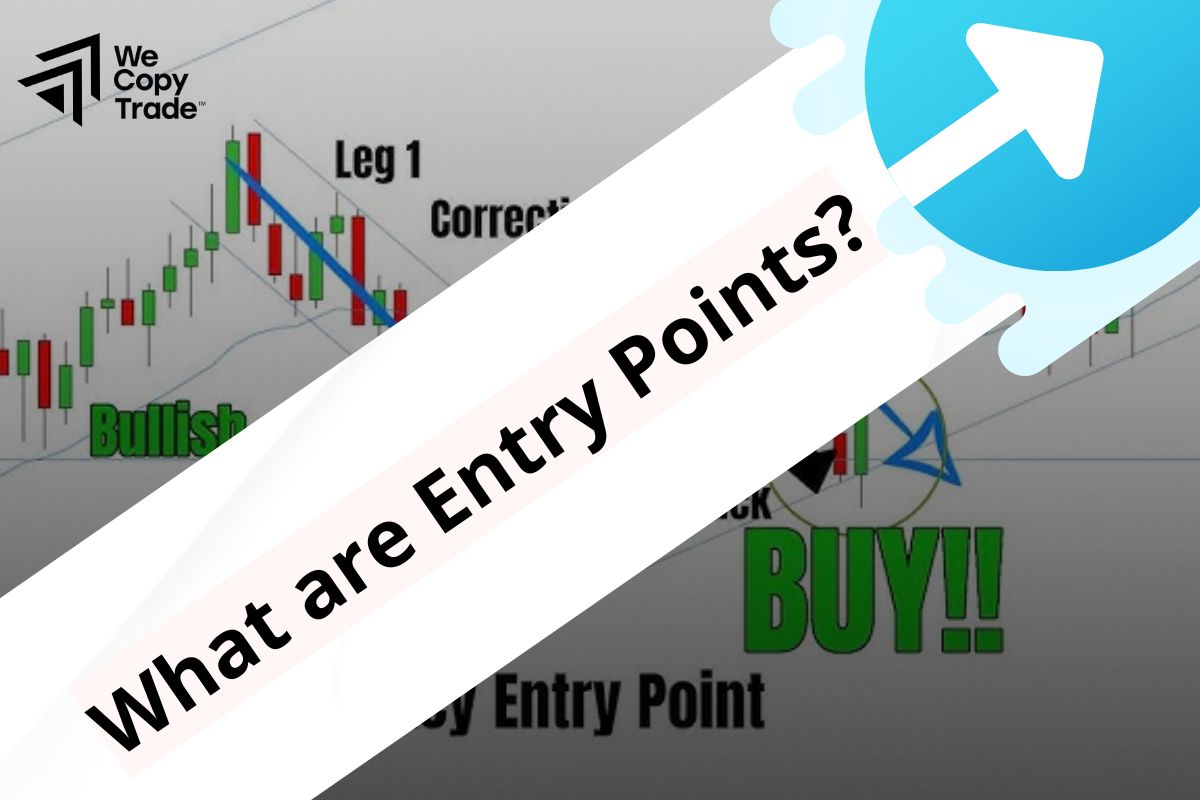
The entry point is the ideal price at which to start an investment. It is the result of careful analysis, helping investors minimize risk and increase their chances of success. Instead of making decisions based on emotions, investors will rely on technical indicators and fundamental analysis to determine the optimal time to buy.
What are Exit Points?
Exit point is the price at which an investor decides to sell an asset to lock in profits or limit losses. Determining the correct exit point is one of the most important factors in trading, it directly affects the effectiveness of the investment strategy.
See more:
- Guide How To Use The Hybrid Trading Strategy In a Right Way
- What is Manual Trading? Characteristics of Manual Traders
- 5 Techniques Enter Orders Easily with Position Trading
- 4 Methods to Use Swing Trading Effectively in Forex 2024
How To Identify Entry and Exit Points in Stock Market
Timing your entry and exit is a key factor in your investment success. Timing correctly will help you maximize your profits and minimize your risks. Here are some easy how To Identify Entry and Exit Points in Stock Market your trades:
Technical Analysis
This is a powerful tool for investors to predict future price trends. By studying price charts, traders can identify potential buy and sell signals. You can use analysis tools such as:
- Candlestick charts are widely used in technical analysis. Each candle carries important information about market sentiment, helping investors make more accurate trading decisions.
- Support and resistance levels are also important factors to consider. When prices touch these levels, there will often be significant fluctuations.
Trend Analysis

This is one of the most important tools in trading. By identifying the market trend, investors can make appropriate buying and selling decisions. In which:
- Moving averages are a simple but effective tool to identify trends. When a short-term average crosses above a long-term average, it is usually a buy signal. Conversely, when a short-term average crosses below a long-term average, it is usually a sell signal.
- Trend lines are also a useful tool to identify trends. When prices break out of a trend line, it is usually a signal that the trend is changing.
RSI và MACD
These are two useful tools that help investors “measure the strength” of the market.
- RSI (Relative Strength Index) is an indicator that fluctuates between 0 and 100. When the RSI is above 70, it shows that the market is overbought and may be about to fall. Conversely, when the RSI is below 30, it shows that the market is oversold and may be about to rise.
- MACD (Moving Average Convergence Divergence) compares two moving averages to determine trends and reversal points. When the MACD line crosses above the signal line, it is usually a buy signal. When the MACD line dips below the signal line, it can be a bearish sign, suggesting a potential downward trend.
Trading Volume

- In an uptrend: When prices rise and are accompanied by high volume, it shows that there are more buyers, reinforcing the uptrend.
- In a downtrend: If prices fall and volume decreases, it may indicate that selling pressure is weakening and the downtrend may be coming to an end.
Top Effective Entry and Exit Points Strategy
Let’s explore the top strategies that are trusted so that we can take advantage of and promote the most effective entry and exit points:
News and events
- A company’s earnings report is like a test. If the results are good, investors will be confident and buy more shares, causing the stock price to increase. Conversely, if the results are poor, investors will worry and sell, causing the price to decrease.
- Economic indicators such as GDP or employment are like big news in the newspaper. When there is good news, the market will usually react positively. Conversely, bad news can cause the market to go down.
- To invest effectively, investors need to closely monitor current events. By capturing important information, investors can make appropriate entry and exit decisions to optimize profits.
Set Stop Loss and Take Profit
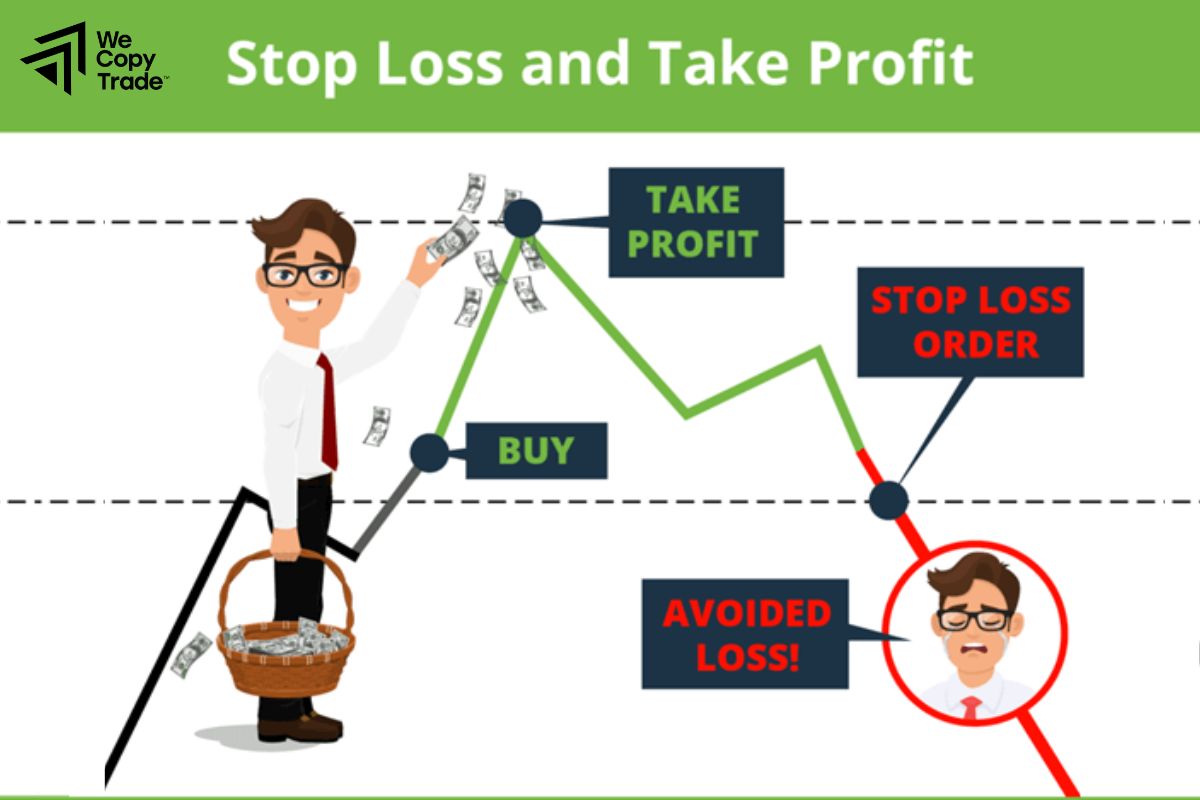
- Risk management is extremely important in investing. Especially in volatile market situations, we are often influenced by emotions, such as fear when prices fall or greed when prices rise. Therefore, setting stop loss and take profit will help you protect your capital and avoid too much loss.
- When the stock price falls to the level you set in advance, the stop loss order will automatically sell the stock to limit losses. Conversely, when the price rises to the level you want, the take profit order will automatically sell to ensure profits.
Go Against the Crowd
Crowd psychology often leads to extreme investment decisions. When the market is too hot, everyone wants to buy, pushing prices up. Conversely, when the market is falling, everyone wants to sell, causing prices to fall even further. Successful traders are those who know how to take advantage of extreme market conditions to make decisions that go against the crowd. Of course, you need to have basic knowledge of technical analysis and fundamental analysis to determine this moment.
Algorithmic Trading

- With this form of trading, investors will set up a series of entry and exit points for the computer to automatically execute. For example, when the stock price drops to a certain level and the technical indicators give a buy signal, the computer will automatically buy.
- The main purpose of using this type of trading is to help investors eliminate the emotional factor when making decisions. Instead of being influenced by fear or greed, the computer will execute trading orders objectively and accurately based on pre-programmed rules.
- In addition, algorithmic transactions performed by computers are very fast, taking only a few seconds, helping investors grasp profitable opportunities quickly and effectively.
Backtesting
To maximize the effectiveness of entry and exit points, backtesting is a must before actually putting them into practice. Here, traders “test” their strategies on historical data, identify their strengths and weaknesses, and make adjustments accordingly.
Conclusion
In conclusion, knowing how to identify entry and exit points in stock market means you are very close to success. Hopefully this article will help you understand how to place orders more effectively and remember not to be too subjective when placing orders because the market is a place with many potential fluctuations and risks.
See now:





