













Have you heard of momentum trading? This is considered one of the most effective strategies with extremely fast profit. However, to achieve maximum efficiency, it requires the consultant to clearly understand how it works and its advantages and disadvantages. Following the following article, I will summarize all the refractive errors you need in this strategy. Let’s go!
What is Momentum Trading?

Momentum investing is a popular trading strategy that appeals to investors who like excitement and want to take advantage of short-term market fluctuations to make quick profits. Simply, momentum trading is buying stocks that are rising in price and selling them when they start to fall. The idea behind this strategy is that what goes up will continue to go up, and what goes down will continue to fall.
See now:
- What is Range Trading? Top 3 Range Trading Strategies
- Top Effective Indicators You Should Know In Trend Trading
- How To Identify Entry and Exit Points in Stock Market
Why should we Trade Momentum?
When the market is in a strong trend, you can make significant profits in a short period of time. For example, if you buy a stock at the beginning of its rise and sell it at its peak, you can double your investment in just a few weeks.
Momentum trading is based on the principle of crowd psychology. When many people buy a stock, the price tends to increase and vice versa. Momentum investors try to get ahead of the crowd by buying when the price is low and selling when the price is high.
Momentum investing allows you to quickly adapt to changes in the market. You can easily switch from one trend to another to maximize your profits.
Drawbacks of Momentum Investing

Momentum trading is an attractive strategy, but it also comes with significant risks. Here are some of the main drawbacks to be aware of:
- One of the biggest risks of momentum trading is assuming that a trend will continue forever. In reality, any trend can reverse, and entering too late in a downtrend can result in large losses.
- Technical indicators often lag behind actual price action. This means that by the time you receive a buy or sell signal, the price may have already moved a significant distance.
- Momentum trading is often based on crowd psychology. When many investors join a trend, it can push prices too high or too low, creating asset bubbles and leading to sharp crashes.
- Illiquid assets can be difficult to buy or sell quickly, especially in volatile market conditions. This can lead to large losses if you are unable to exit your position in time.
- Trading costs such as brokerage fees and taxes can eat into your profits, especially if you make multiple trades in a short period of time.
- Momentum trading requires you to spend a lot of time monitoring the market and making quick decisions. This can be stressful and affect your personal life.
Principles of Momentum Trading

- Investors use technical analysis tools such as trend lines, moving averages, and ADX to determine whether the price of a stock, index, or market is rising or falling.
- When a clear and strong trend is identified, investors will buy if the trend is up and sell if the trend is down.
- Investors will closely monitor price movements and technical indicators to assess whether the trend is continuing.
- When the trend shows signs of weakening or reversing, investors will take profits and exit the position.
For example:
Suppose you see that the price of a technology stock has been rising steadily over the past few weeks. Using technical analysis tools, you conclude that the stock is in a strong uptrend. You decide to buy the stock in the hope that the price will continue to rise.
Top Common Momentum Trading Indicators
In the world of momentum trading, traders are always looking for signs that a trend is forming and likely to continue. Technical analysis is a useful toolkit to help them do just that. Let’s explore the most basic and popular indicators:
Trend Lines
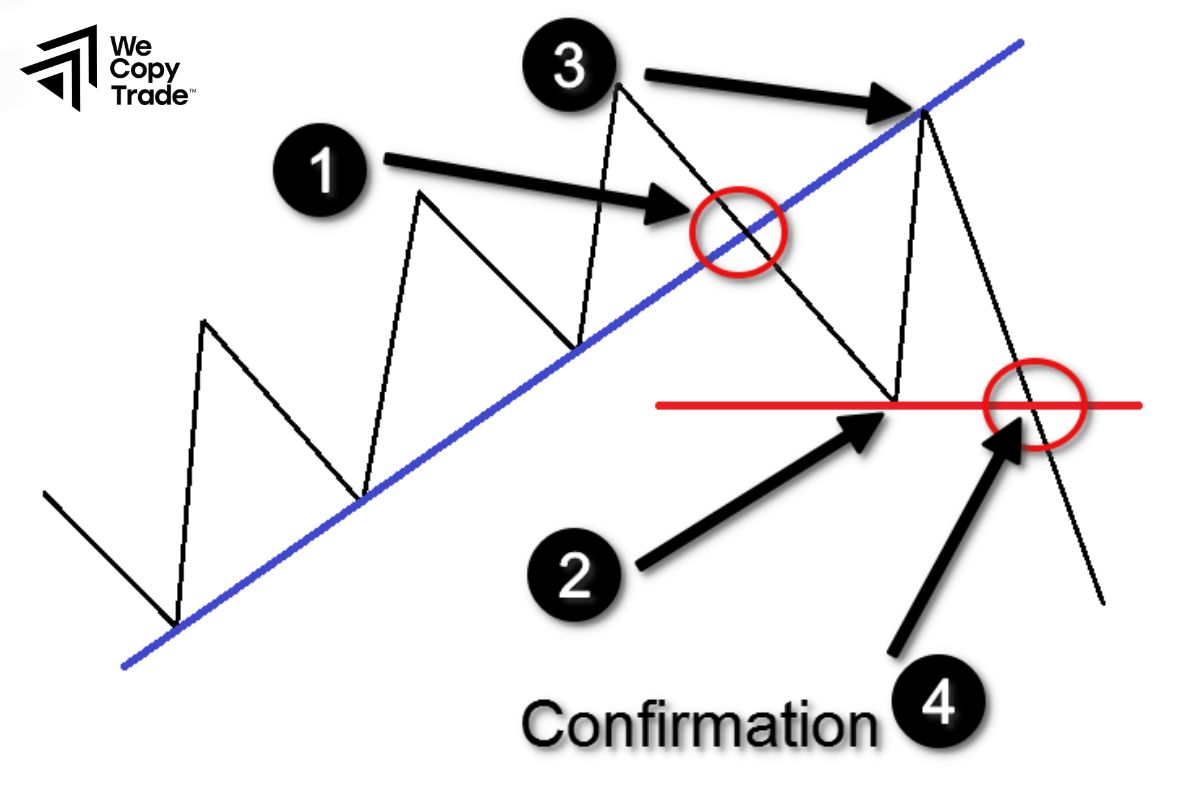
A trend line is like a path that prices are traveling. It is formed by connecting the highest points (for an uptrend) or lowest points (for a downtrend) on a chart.
When prices move in the direction of the trend line, it shows that the trend is being maintained. Conversely, when prices break the trend line, it can be a signal that the trend is changing.
Moving Averages
A moving average calculates the average price of an asset over a certain period of time. Moving averages help smooth out price data, eliminate short-term fluctuations, and provide a clearer picture of the overall market trend.
An uptrend is when the price is trading above the moving average. Conversely, a downtrend is when the price is trading below the moving average.
Stochastic Oscillator
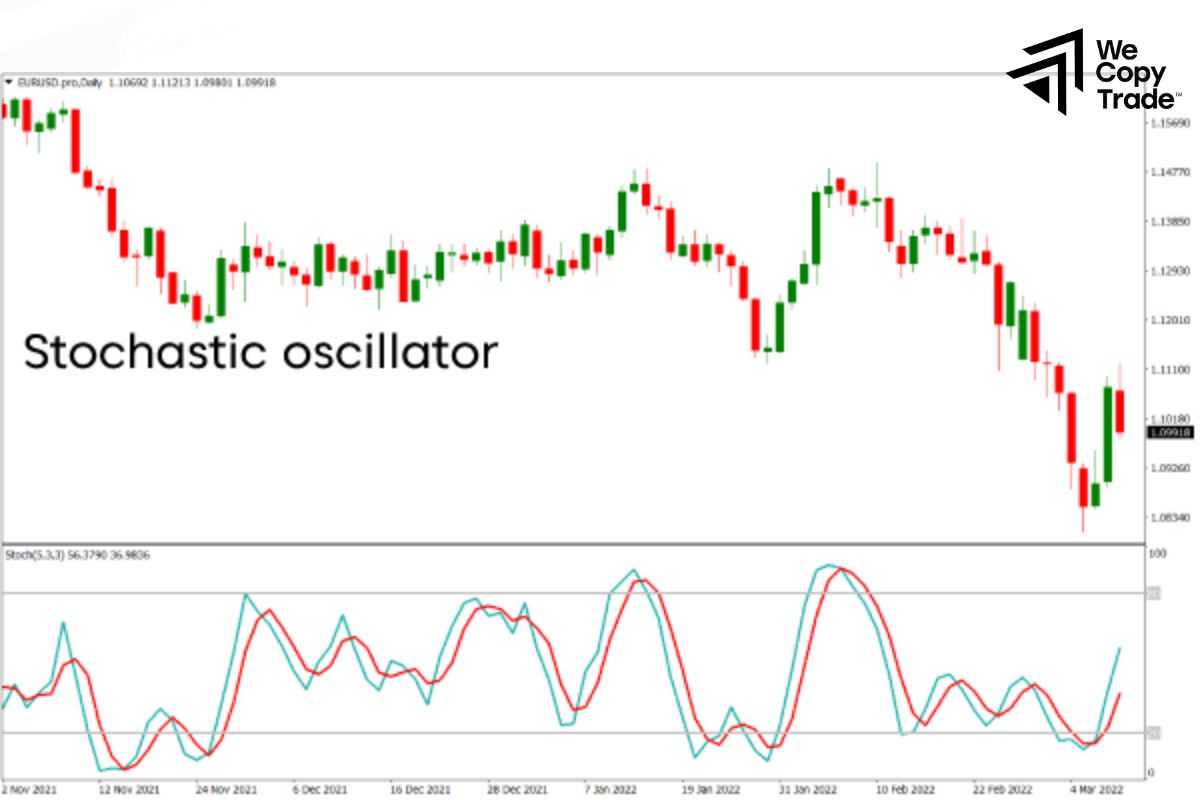
The stochastic oscillators will help you determine whether a stock’s price is accelerating or decelerating, and whether it is nearing a new high. This indicator compares a stock’s most recent closing price to its price range over a given period of time (e.g. 14 days).
If the price closes near the high of the price range, it indicates that bullish momentum is strong. Conversely, if the price closes near the low, bearish momentum is dominant.
What the indicator means:
- Above 80: The market is overbought. This means that the price has risen too fast and may be about to fall.
- Below 20: The market is oversold. This means that the price has fallen too far and may be about to rise.
- Between 20 and 80: The market is trending.
Average Directional Index (ADX)
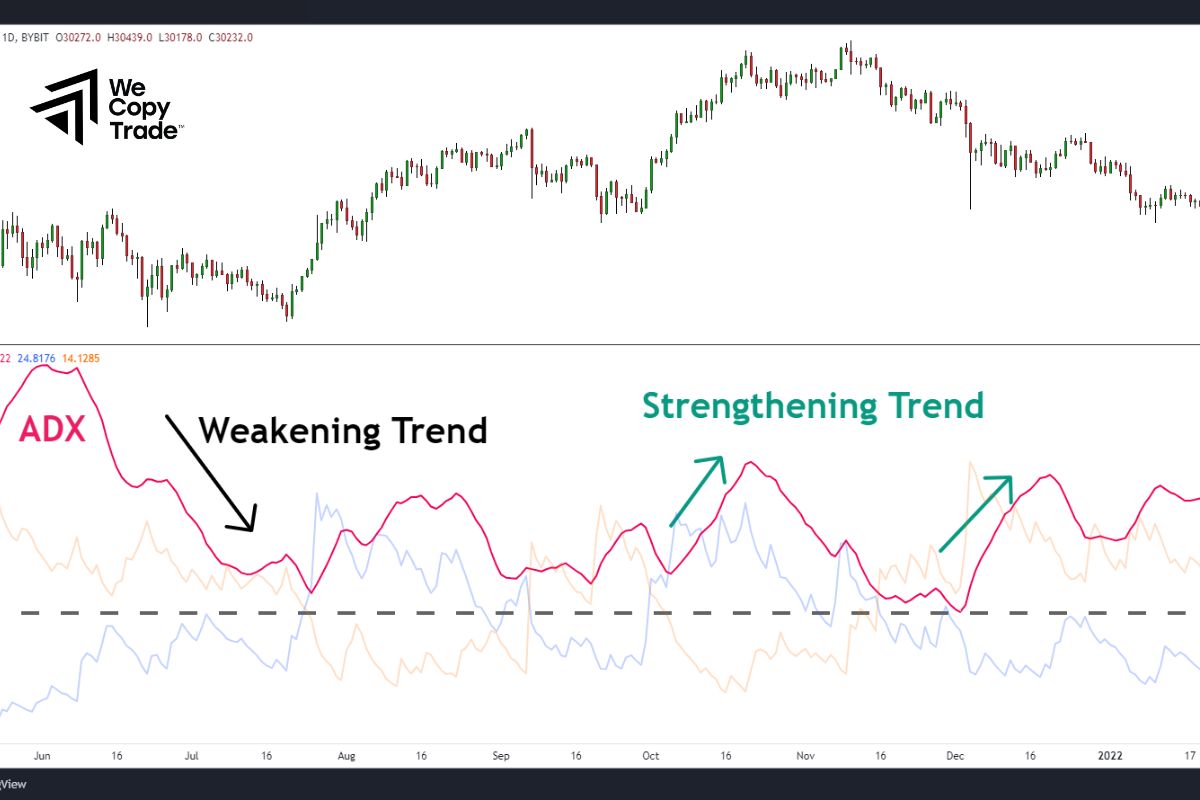
ADX is like a compass in the stock market, helping to calculate the level of price change over a certain period of time. If the price continues to increase or decrease for a long time, the ADX will increase, indicating that the trend is strong. The ADX value increases shows that the trend is stronger.
Meaning of ADX value levels:
- Below 25: The market is fluctuating, with no clear trend.
- Above 25: There is a trend forming.
- The greater than 25: The stronger the trend.
When the price increases but the ADX decreases, it shows that the trend may be about to reverse. Conversely, when the price decreases but the ADX increases, it shows that the trend may be about to reverse.
For example:
- ADX = 30: Shows that the market is in a clear trend, but not too strong.
- ADX = 50: Shows that the market is in a very strong trend.
Conclusion
In conclusion, momentum trading can bring attractive returns, but it also comes with great risks. Before deciding to apply this strategy, you should be well equipped with your investment goals, risk tolerance and knowledge.
See more:





