




















Clients are provided with a simulated account. Their trading activity on this account is replicated in real-time by our exclusive algorithms to our live firm trading account, generating actual cash flow.

 WeMasterTrade CEO
Why Us
Why Use WMT Capital
Instead of Your Own Money

Save
If it takes at least 12 months to save $10,000 for a trading account, why not join WMT where we fund you instantly from $10,000 up to $200,000?

Capital
We remove this concern by allowing you to have a customization trading account size for a better returns. Thanks to our liquidity providers, we can leverage you with buying power from $1 million USD to $100 million USD.

Risk of Loss
A lot of traders save a lot of money in a long period, trading with own fund can potentially lead to huge loss and un-recover. With WeMasterTrade, your potential losses are covered by us so you can have peace in mind while trading.

Account Setup
We handle all the technology and account setup for you. All you need is to pay a set up fee, one click for online contract and then start trade right away.

How it work
How the Funded
Challenge Works
WeMasterTrade introduces the Challenge Package, specifically designed for traders seeking a structured and beginner-friendly way to enter the funded trading world. Here's how it works:

Step 1
Trading Skill Assessment
- You need to achieve a 8% performance-based rewards during this challenge phase while maintaining proper risk management.
- We will evaluate your trading performance and ability to protect your capital in a real market environment.
- If you pass, you'll move on to the next stage.
Step 2
Stability Assessment
- In this phase, you need to achieve a 6% performance-based rewards.
- This step evaluates your ability to sustain performance-based rewards and manage risk over the long term.
- You’ll start earning performance-based rewards from your trades during this phase, even before receiving full evaluation.
Step 3
Funding Stage
- Once you’ve successfully completed both evaluation stages, you will receive trading capital from WeMasterTrade.
- The company will copy your trades directly.
- You will earn up to 90% of the performance-based rewards from the trades you make.


Package
Prop Trading Rules & Benefits
Challenge Package
$10,000
$25,000
$50,000
$100,000
No challenge
Phase 1
$45/per time
Phase 2
N/A/per time
Funded
Refund/per time
 One-Time
Fee
$45
N/A
Refund
 Free
Free
Swap
 Maximum
Daily Loss
5% ($500)
5% ($500)
5% ($500)
 Maximum
Overall Loss
10% ($1,000)
10% ($1,000)
10% ($1,000)
 Performance-based Rewards Target
8% ($800)
6% ($600)
N/A
 Reward
Share
N/A
30%
90%
 Leverage
1:100
1:100
Up to 1:100
 Reset
Reset
Discount
30%
30%
N/A
Phase 1
$100/per time
Phase 2
N/A/per time
Funded
Refund/per time
One-Time
Fee
$100
N/A
Refund
Free
Swap
Maximum
Daily Loss
5% ($1,250)
5% ($1,250)
5% ($1,250)
Maximum
Overall Loss
10% ($2,500)
10% ($2,500)
10% ($2,500)
Performance-based Rewards Target
8% ($2,000)
6% ($1,500)
N/A
Reward
Share
N/A
30%
90%
Leverage
1:100
1:100
Up to 1:100
Reset
Discount
30%
30%
N/A
Phase 1
$175/per time
Phase 2
N/A/per time
Funded
Refund/per time
One-Time
Fee
$175
N/A
Refund
Free
Swap
Maximum
Daily Loss
5% ($2,500)
5% ($2,500)
5% ($2,500)
Maximum
Overall Loss
10% ($5,000)
10% ($5,000)
10% ($5,000)
Performance-based Rewards Target
8% ($4,000)
6% ($3,000)
N/A
Reward
Share
N/A
30%
90%
Leverage
1:100
1:100
Up to 1:100
Reset
Discount
30%
30%
N/A
Phase 1
$320/per time
Phase 2
N/A/per time
Funded
Refund/per time
One-Time
Fee
$320
N/A
Refund
Free
Swap
Maximum
Daily Loss
5% ($5,000)
5% ($5,000)
5% ($5,000)
Maximum
Overall Loss
10% ($10,000)
10% ($10,000)
10% ($10,000)
Performance-based Rewards Target
8% ($8,000)
6% ($6,000)
N/A
Reward
Share
N/A
30%
90%
Leverage
1:100
1:100
Up to 1:100
Reset
Discount
30%
30%
N/A
Capital Package
Account Size
$200,000
$100,000
$50,000
$25,000
$10,000
$5,000
$25,000
$200,000
$100,000
$50,000
$25,000
$10,000
$5,000
$400,000
$200,000
$100,000
$50,000
$25,000
$10,000
 51010 Account $10K
- we fund you$5,000
- Swap Fee
- Free-Swap
- Buying Power
- $500,000
- Daily Loss
- $250 (5%)
- Max Loss
- $500 (10%)
- Profit Target To Withdraw
- 10%
- One-Time Fee
-
20% OFF $44
$55
-
$458Avg. Reward Based on average WeMasterTrade payouts worldwide
- we fund you$10,000
- Swap Fee
- Free-Swap
- Buying Power
- $1,000,000
- Daily Loss
- $500 (5%)
- Max Loss
- $1,000 (10%)
- Profit Target To Withdraw
- 10%
- One-Time Fee
-
20% OFF $76
$95
-
$825Avg. Reward Based on average WeMasterTrade payouts worldwide
- we fund you$25,000
- Swap Fee
- Free-Swap
- Buying Power
- $2,500,000
- Daily Loss
- $1,250 (5%)
- Max Loss
- $2,500 (10%)
- Profit Target To Withdraw
- 10%
- One-Time Fee
-
20% OFF $196
$245
-
$2,162Avg. Reward Based on average WeMasterTrade payouts worldwide
- we fund you$50,000
- Swap Fee
- Free-Swap
- Buying Power
- $5,000,000
- Daily Loss
- $2,500 (5%)
- Max Loss
- $5,000 (10%)
- Profit Target To Withdraw
- 10%
- One-Time Fee
-
20% OFF $302
$378
-
$4,115Avg. Reward Based on average WeMasterTrade payouts worldwide
- we fund you100,000
- Swap Fee
- Free-Swap
- Buying Power
- $10,000,000
- Daily Loss
- $5,000 (5%)
- Max Loss
- $10,000 (10%)
- Profit Target To Withdraw
- 10%
- One-Time Fee
-
20% OFF $580
$725
-
$8,440Avg. Reward Based on average WeMasterTrade payouts worldwide
- we fund you$200,000
- Swap Fee
- Free-Swap
- Buying Power
- $20,000,000
- Daily Loss
- $10,000 (5%)
- Max Loss
- $20,000 (10%)
- Profit Target To Withdraw
- 10%
- One-Time Fee
-
20% OFF $1,120
$1,400
-
$16,840Avg. Reward Based on average WeMasterTrade payouts worldwide
- we fund you$25,000
- Swap Fee
- Free-Swap
- Buying Power
- $2,500,000
- Daily Loss
- $500 (2%)
- Max Loss
- $1,000 (4%)
- Profit Target To Withdraw
- 6%
- One-Time Fee
-
55% OFF $112.5
$250
- we fund you$5,000
- Swap Fee
- Free-Swap
- Buying Power
- $500,000
- Daily Loss
- $250 (5%)
- Max Loss
- $500 (10%)
- Profit Target To Withdraw
- N/A
- One-Time Fee
-
20% OFF $52
$65
-
$571Avg. Reward Based on average WeMasterTrade payouts worldwide
- we fund you$10,000
- Swap Fee
- Free-Swap
- Buying Power
- $1,000,000
- Daily Loss
- $500 (5%)
- Max Loss
- $1,000 (10%)
- Profit Target To Withdraw
- N/A
- One-Time Fee
-
20% OFF $84
$105
-
$842Avg. Reward Based on average WeMasterTrade payouts worldwide
- we fund you$25,000
- Swap Fee
- Free-Swap
- Buying Power
- $2,500,000
- Daily Loss
- $1,250 (5%)
- Max Loss
- $2,500 (10%)
- Profit Target To Withdraw
- N/A
- One-Time Fee
-
20% OFF $220
$275
-
$2,256Avg. Reward Based on average WeMasterTrade payouts worldwide
- we fund you$50,000
- Swap Fee
- Free-Swap
- Buying Power
- $5,000,000
- Daily Loss
- $2,500 (5%)
- Max Loss
- $5,000 (10%)
- Profit Target To Withdraw
- N/A
- One-Time Fee
-
20% OFF $344
$430
-
$3,827Avg. Reward Based on average WeMasterTrade payouts worldwide
- we fund you100,000
- Swap Fee
- Free-Swap
- Buying Power
- $10,000,000
- Daily Loss
- $5,000 (5%)
- Max Loss
- $10,000 (10%)
- Profit Target To Withdraw
- N/A
- One-Time Fee
-
20% OFF $672
$840
-
$7,425Avg. Reward Based on average WeMasterTrade payouts worldwide
- we fund you$200,000
- Swap Fee
- Free-Swap
- Buying Power
- $20,000,000
- Daily Loss
- $10,000 (5%)
- Max Loss
- $20,000 (10%)
- Profit Target To Withdraw
- N/A
- One-Time Fee
-
20% OFF $1,312
$1,640
-
$15,320Avg. Reward Based on average WeMasterTrade payouts worldwide
- we fund you$10,000
- Swap Fee
- Free-Swap
- Buying Power
- $1,000,000
- Daily Loss
- $200 (2%)
- Max Loss
- $400 (4%)
- Profit Target To Withdraw
- 6%
- One-Time Fee
- 20% OFF $35
-
$462Avg. Reward Based on average WeMasterTrade payouts worldwide
- we fund you$25,000
- Swap Fee
- Free-Swap
- Buying Power
- $2,500,000
- Daily Loss
- $500 (2%)
- Max Loss
- $1,000(4%)
- Profit Target To Withdraw
- 6%
- One-Time Fee
- 20% OFF $88
-
$1,155Avg. Reward Based on average WeMasterTrade payouts worldwide
- we fund you$50,000
- Swap Fee
- Free-Swap
- Buying Power
- $5,000,000
- Daily Loss
- $1,000 (2%)
- Max Loss
- $2,000 (4%)
- Profit Target To Withdraw
- 6%
- One-Time Fee
- 20% OFF $175
-
$2,110Avg. Reward Based on average WeMasterTrade payouts worldwide
- we fund you100,000
- Swap Fee
- Free-Swap
- Buying Power
- $10,000,000
- Daily Loss
- $2,000 (2%)
- Max Loss
- $4,000 (4%)
- Profit Target To Withdraw
- 6%
- One-Time Fee
- 20% OFF $345
-
$4,465Avg. Reward Based on average WeMasterTrade payouts worldwide
- we fund you$200,000
- Swap Fee
- Free-Swap
- Buying Power
- $20,000,000
- Daily Loss
- $4,000 (2%)
- Max Loss
- $8,000 (4%)
- Profit Target To Withdraw
- 6%
- One-Time Fee
- 20% OFF $690
-
$9,140Avg. Reward Based on average WeMasterTrade payouts worldwide
- we fund you$400,000
- Swap Fee
- Free-Swap
- Buying Power
- $40,000,000
- Daily Loss
- $8,000 (2%)
- Max Loss
- $16,000 (4%)
- Profit Target To Withdraw
- 6%
- One-Time Fee
- 20% OFF $1,380
-
$18,763Avg. Reward Based on average WeMasterTrade payouts worldwide
Why choose?
Why choose
The Challenge Package
1st
Weekend / Overnight
Hold trades overnight and over the weekend with no restrictions, enjoying low swap fees ideal for all trading strategies. Alternatively, you can pay a small additional fee to enjoy completely swap-free trading.
2nd
News Trading Allowed
At WMT, we believe in empowering traders. Trade the news freely and execute your strategy without any restrictions.
3rd
Wide Range of Simulated Symbols
Explore a rich portfolio of assets.
4th
30% Reward Share in Challenge Phase
WeMasterTrade stands out as a trading evaluation platform offering a 30% reward share based on performance achieved during the Challenge Phase.
The Features
Why choose WeMasterTrade
for Prop Trading
Explore the features that make WeMasterTrade stand out.
Criteria |
Challenge Package |
Instant Package |
|---|---|---|
| Target Audience | New clients entering proprietary trading environments or derivative markets | Experienced traders looking for a quick solution |
| Process | Simple 2-phase process, easy for customers to get familiar | Immediate evaluating, no need for challenge phase |
| Account Type | Accounts for all asset types | Focused on one specific asset type to optimize profit |
| Trading Flexibility | No limit on news, swing, or scalp trading, no contract size limits | No limit on news, swing, or scalp trading, no contract size limits |
| Performance-based Rewards Sharing | Reward sharing from the challenge phase and 90% rate after evaluating | Reward sharing up to 90% as soon as the account meets conditions |
| Retry Option | Reset discount program for retake the challenge phase at a lower cost | N/A |
| Best Option For | Beginners, to get familiar and develop trading skills at the lowest cost | Experienced traders seeking flexibility and performance-based rewards |
Challenge
Instant
- Target Audience
- Customers new to Prop Firms or Derivatives Markets
- Fee Structure
- Low fees, perfect for beginners and suitable for all levels
- Process
- Simple 2-phase process, easy for customers to get familiar
- Account Type
- Accounts for all asset types
- Trading Flexibility
- No limit on news, swing, or scalp trading, no contract size limits
- Performance-based Rewards Sharing
- Reward sharing from the challenge phase and 90% rate after funding
- Retry Option
- Reset discount program for retake the challenge phase at a lower cost
- Best Option For
- Beginners, to get familiar and develop trading skills at the lowest cost
- Target Audience
- Experienced traders looking for a quick solution
- Fee Structure
- Reasonable fees, suitable for professional traders
- Process
- Immediate funding, no need for challenge phase
- Account Type
- Focused on one specific asset type to optimize performance-based rewards
- Trading Flexibility
- No limit on news, swing, or scalp trading, no contract size limits
- Performance-based Rewards Sharing
- Reward sharing up to 90% as soon as the account meets conditions
- Retry Option
- N/A
- Best Option For
- Experienced traders seeking flexibility and performance-based rewards

Traders Stories
WeMasterTrade Interviews
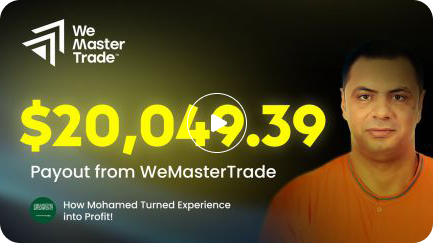
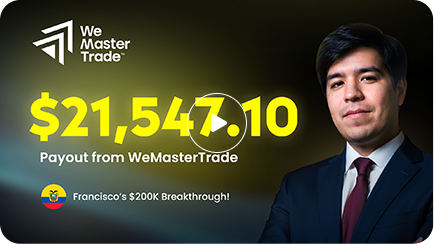
Every month, we interview successful traders to share the latest insights, trends, and strategies in the industry — helping our clients gain valuable experience and improve their earnings. Check out our latest videos here!

Subscribe to Stay
Ahead in Trading!
Don't miss out on real stories, proven strategies, and big payouts from top traders.

Payouts
Fast Payouts for
Funded Trading
Enjoy hassle-free payouts as a reward for your simulated trading across professional trading platforms. Because you shouldn’t wait for your money.
24hAvg Payout Time
1dDaily Payout
24/5Customer Support
Bank Transfer
Money in the bank within
hours of your request

Payouts
We support payouts via USDC and other stablecoins

Debit/Credit/Prepaid
Cards
Use your performance-based rewards directly with our branded Visa/MasterCard/American Express/JCB...

Payouts
Load More





