













Value at Risk Analysis is an essential tool for managing financial risk, providing a clear estimate of the potential losses in a given portfolio over a specific period. By understanding VaR, investors and risk managers can make informed decisions to safeguard their investments and minimize exposure. Ready to take control of your financial risk? Learn how Value at Risk can help you make smarter, more secure investment decisions today!
What is Value at Risk Analysis?
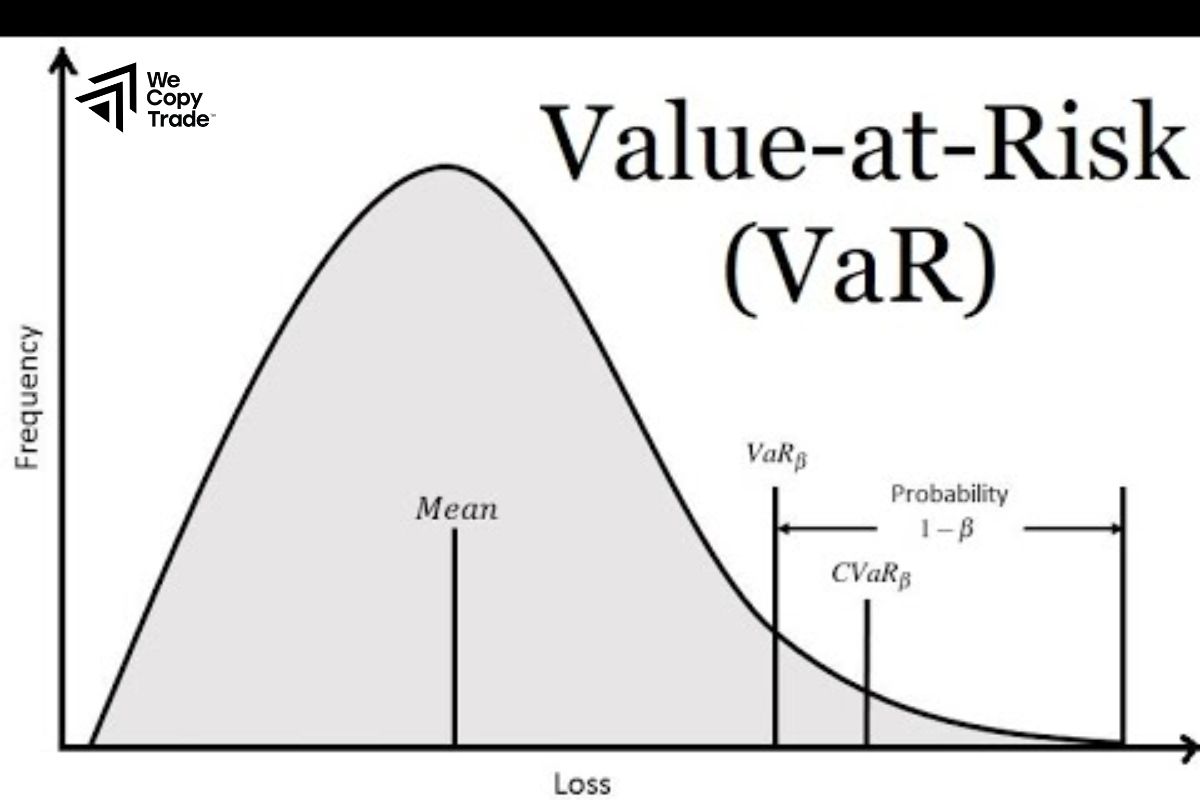
Value at Risk Analysis is a financial risk management technique used to estimate the potential loss in value of an investment portfolio over a specific time period, given normal market conditions. It provides a quantitative measure of the risk of loss and is typically expressed as the maximum expected loss with a certain level of confidence (e.g., 95% or 99%).
See more:
- Tips Simplify Your Financial Risks Management Process
- Financial Risk Assessment, Identification and Management
- What is interest rate risk? How to manage interest rates
Key components of VaR include
- Time period: The length of time over which the risk is assessed (e.g., one day, one month).
- Confidence level: The probability that the loss will not exceed the calculated amount (e.g., 95% confidence means the actual loss will be greater than the VaR 5% of the time).
- Loss amount: The potential loss calculated for the portfolio.
Limitations of Value at Risk Analysis
Value at Risk Analysis is a widely used risk management tool, but it has several limitations that can affect its accuracy and reliability in certain situations. Key limitations of VaR include:
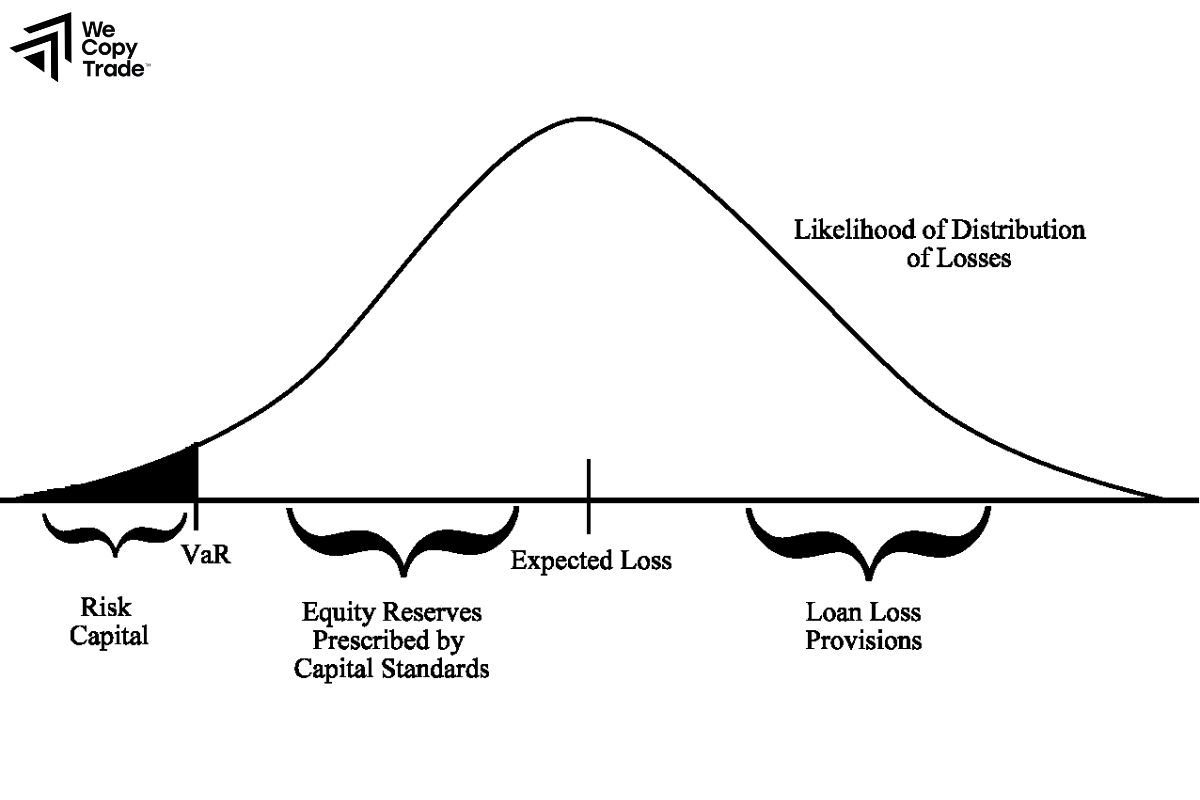
- Inability to Capture Tail Risk: VaR focuses on the most likely losses within a specific confidence interval (e.g., 95% or 99%), but it ignores the worst-case scenarios beyond that threshold. This means it does not provide any information about losses that could occur in the remaining 1% or 5% of cases, known as tail risk. As a result, it underestimates the risk of extreme losses.
- Lack of Additivity: VaR is not always additive across different assets or portfolios. This means that the VaR of a combined portfolio may not equal the sum of the VaRs of its individual components due to correlations between assets. This limitation can make it difficult to assess risk at a group or firm-wide level accurately.
- Ignore Liquidity Risk: VaR does not account for liquidity risk, or the risk that an asset cannot be sold quickly without significantly affecting its price. In stressed markets, liquidity can dry up, making it difficult to exit positions without large losses something VaR typically overlooks.
- Does Not Address the Size of Loss Beyond VaR: While VaR provides the maximum expected loss within a given confidence level, it does not provide any information about the size of losses beyond that point. If a loss exceeds the VaR threshold, the actual size of that loss is unknown and could be far greater.
Methods Used for Calculating Value at Risk Analysis
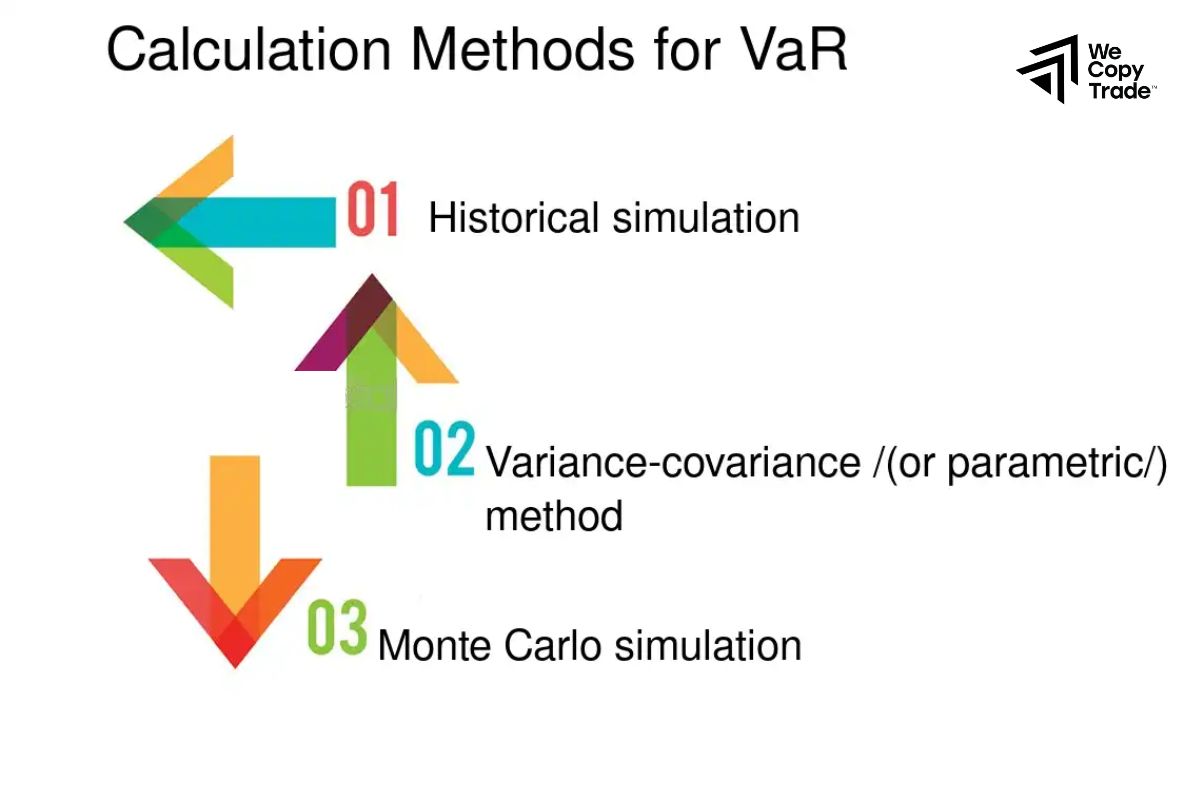
There are three primary methods used for calculating Value at Risk Analysis. Each method has its own advantages, assumptions, and potential limitations. These methods are:
Historical Simulation
This method uses historical data to estimate potential future losses. It assumes that past market behavior can predict future risk and involves calculating VaR based on actual historical returns.
Steps:
- Collect historical returns data for the portfolio or asset.
- Sort these returns from worst to best.
- Determine the VaR by finding the cutoff point that corresponds to the chosen confidence level (e.g., 95% or 99%).
Example:
- If you’re analyzing a portfolio over the past 500 days, and you want a 95% confidence level, you would sort the daily returns and pick the 25th worst loss (5% of 500 = 25). This would represent your VaR.
Variance-Covariance Method (Parametric VaR)
Also known as the analytical or mean-variance method, this approach assumes that returns are normally distributed and uses the portfolio’s mean return and standard deviation to calculate VaR.
Steps:
- Estimate the portfolio’s mean (average) return and standard deviation.
- Use the Z-score corresponding to the confidence level (e.g., 1.65 for 95% confidence).
- Multiply the Z-score by the portfolio’s standard deviation and the portfolio’s value to get the VaR.
Formula:
VaR = Z × σ × Portfolio Value
Where:
- Z is the Z-score for the confidence level (e.g., 1.65 for 95% confidence).
- σ is the portfolio’s standard deviation.
- Portfolio Value is the total value of the portfolio.
Monte Carlo Simulation
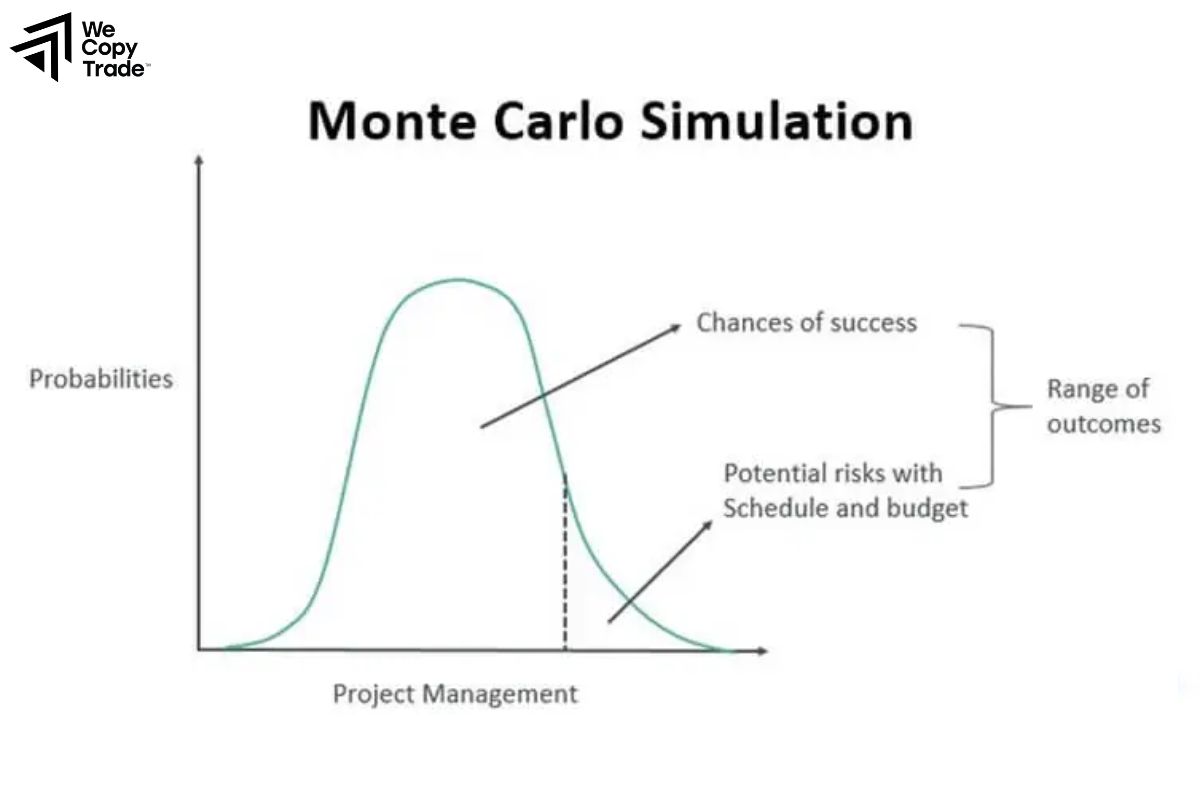
This method uses computational techniques to simulate a wide range of possible market scenarios based on random variables. Monte Carlo simulation can model complex portfolios with non-linear exposures and non-normal return distributions.
Steps:
- Specify the distribution of returns and the relationships between assets.
- Simulate thousands of possible market outcomes for a given time period.
- Calculate the potential loss in each simulation.
- Determine VaR by identifying the loss at the chosen confidence level.
Example:
After simulating 10,000 different possible future portfolio returns, you select the worst 5% of outcomes to represent the potential losses. The 95th percentile of the loss distribution gives you the VaR.
Pros and Cons of Value at Risk Analysis
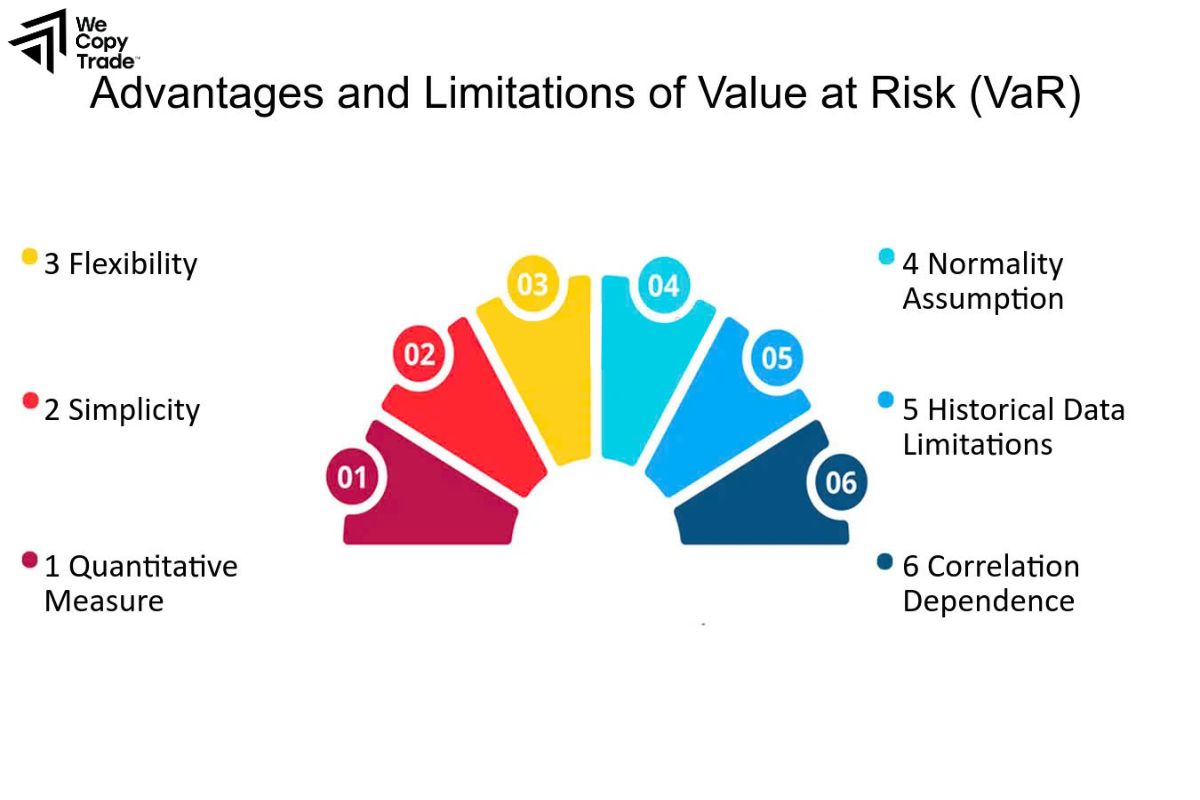
Value at Risk Analysis is a widely used risk measurement tool in finance, but like any method, it has both advantages and disadvantages. Here’s a breakdown of the pros and cons of VaR:
Pros of Value at Risk Analysis
- Simple and Clear: Provides a single, easy-to-understand risk metric.
- Widely Used: Common in finance and regulation, especially for capital requirements.
- Versatile: Applicable to various asset classes and customizable for different time frames.
- Supports Decision-Making: Helps in portfolio risk management, hedging, and capital allocation.
- Regulatory Compliance: Used by financial institutions to meet regulatory standards like Basel III.
Cons of Value at Risk Analysis
- Ignores Extreme Losses: Fails to account for catastrophic events beyond the confidence level (tail risk).
- Relies on Historical Data: May underestimate future risk if market conditions change.
- No Liquidity Risk: Does not consider the difficulty of selling assets in illiquid markets.
- Assumption of Normality: Some models assume returns follow a normal distribution, which isn’t always true.
- False Security: Over-reliance on VaR can lead to underestimating real risk.
FAQ about Value at Risk Analysis

Is VaR reliable during financial crises?
- VaR has limitations during crises because it relies on historical data and may underestimate risk in extreme market conditions or periods of high volatility.
How is VaR used in the stock market?
- In the stock market, VaR helps assess potential losses in portfolios, evaluate market exposure, and guide decisions on asset allocation, hedging, and setting risk limits for trading activities.
Can VaR be used for all types of assets?
- Yes, VaR can be applied to various asset classes, including stocks, bonds, commodities, derivatives, and portfolios of mixed assets.
Conclusion
In conclusion, Value at Risk Analysis is a crucial tool for understanding and managing financial risk. To maximize its effectiveness, consider integrating VaR with complementary risk assessment methods such as Expected Shortfall or stress testing. If you want to enhance your risk management strategies, explore the benefits of Value at Risk today.
See now:





