


You want to invest smartly but still don’t know where to start? How can we predict market fluctuations? MACD is the closest support tool to help you logically shape trends and decide on the next action. Let’s find out how they work and become a successful trader right now!
What is MACD?

MACD stands for moving average convergence divergence. Simply put, MACD is a tool that helps us track changes in stock prices. It helps investors determine whether the stock price is going up or down, and from there make a decision to buy or sell.
MACD is calculated based on the comparison between two moving averages. One line represents the short-term trend, the other line represents the long-term trend. The difference between these two lines will tell us about the momentum of the market. When these two lines intersect or move away from each other, it can be a signal that the price trend is changing.
See now:
What are MACD Signals?
To calculate the MACD line, we compare two moving averages: a short-term (12-day) and a long-term (26-day). The difference between the two lines gives us the MACD line. In addition, we have a signal line, which is calculated based on the MACD line.
- Crossover: When the MACD line “crosses” above the signal line, it is usually a signal that the price may increase. Conversely, when the MACD line “crosses” below the signal line, it can be a signal that the price may decrease.
- Divergence: When the price and the MACD line move in opposite directions, it is called divergence. Divergence can be a warning signal that the current trend may reverse.
- Rapid increase/decrease: When the MACD line moves strongly in one direction, it can indicate that the trend is strengthening.
How to calculate MACD
To calculate the MACD indicator, we use the following formula
- MACD = EMA(12) – EMA(26)
Where:
- EMA(12): Exponential moving average of the last 12 days.
- EMA(26): Exponential moving average of the last 26 days.
MACD value meaning
- When MACD is positive: This shows that the short-term moving average (12 days) is above the long-term moving average (26 days), suggesting that the price is in an uptrend.
- When MACD is negative: This shows that the short-term moving average is below the long-term moving average, suggesting that the price is in a downtrend.
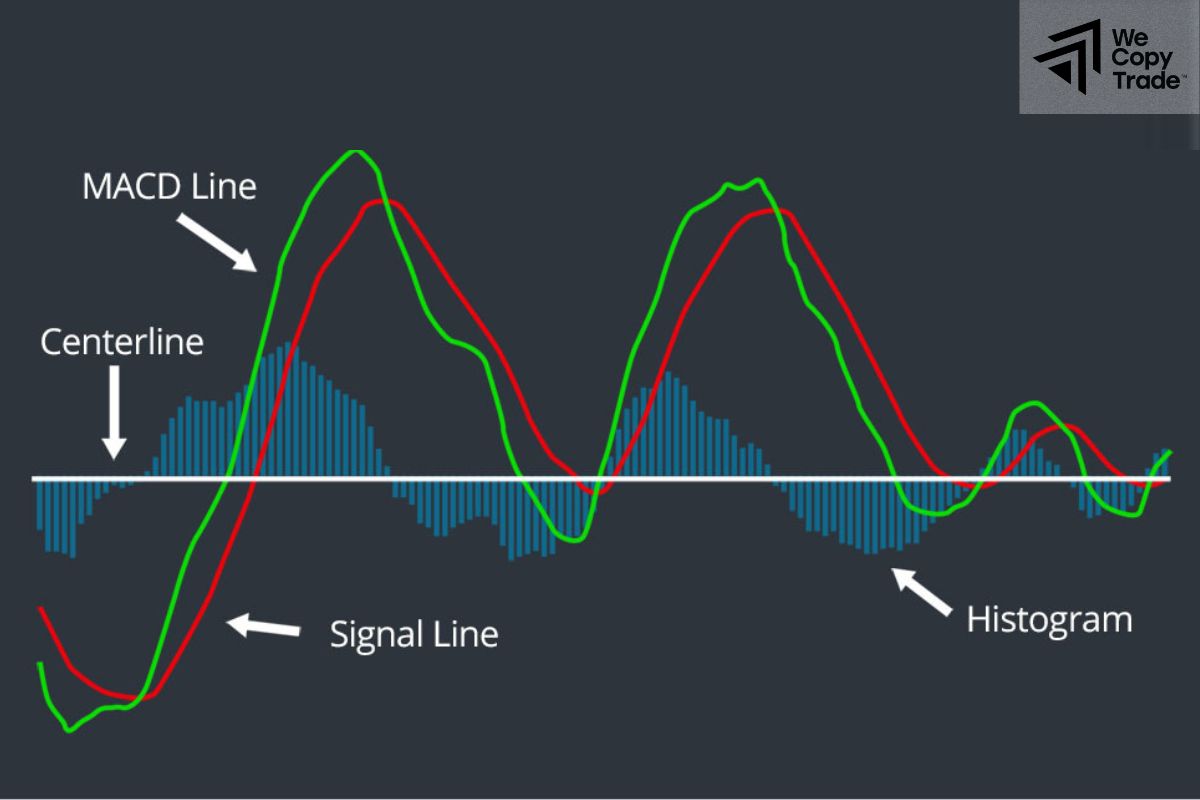
Components of the MACD indicator
The MACD indicator is made up of the following main components:
- The MACD line: represents the difference between the short-term and long-term price trends. The MACD line is calculated by subtracting the exponential moving average (EMA) of the last 12 days from the exponential moving average of the last 26 days.
- The signal line: This is the 9-day exponential moving average of the MACD line. The signal line helps smooth out the MACD line and create clearer trading signals.
- Histogram: A bar chart showing the difference between the MACD line and the signal line at each point in time. The histogram helps investors easily recognize divergence and convergence signals.
- The zero line: A horizontal line with a value of 0. The zero line acts as a boundary line, helping investors determine whether the current trend is up (MACD positive) or down (MACD negative).
These components work together to provide investors with important information about:
- Market Trend: The MACD and signal lines show whether the price trend is up, down, or sideways.
- Momentum: The histogram helps measure the strength of the trend.
- Buy/Sell Points: When the MACD line crosses the signal line or when divergence signals appear, it can be an opportunity to make a trade.
Identifying the MACD Line on a Stock Chart Simply

Let’s explore how to read and understand the MACD line on the following stock chart:
Based on color
- MACD line: Usually green. This line shows the difference between the short-term and long-term price trends.
- Signal line: Usually red. This line is a moving average of the MACD line, helping to determine buy and sell signals.
Decoding the meaning of the MACD line
- Positive MACD: When the MACD line is above the signal line and has a positive value, it shows that the price trend is up. The larger the distance between the two lines, the stronger the uptrend.
- Negative MACD: Conversely, when the MACD line is below the signal line and has a negative value, it shows that there is a downtrend. The larger the distance between the two lines, the stronger the downtrend.
Understanding the MACD Line Movement
- Divergence: When the MACD line and the price line move in opposite directions, it is a sign that the current trend may reverse.
- Convergence: When the MACD line and the price line move in the same direction, it can be a confirmation signal of the current trend.
MACD vs. Relative Strength
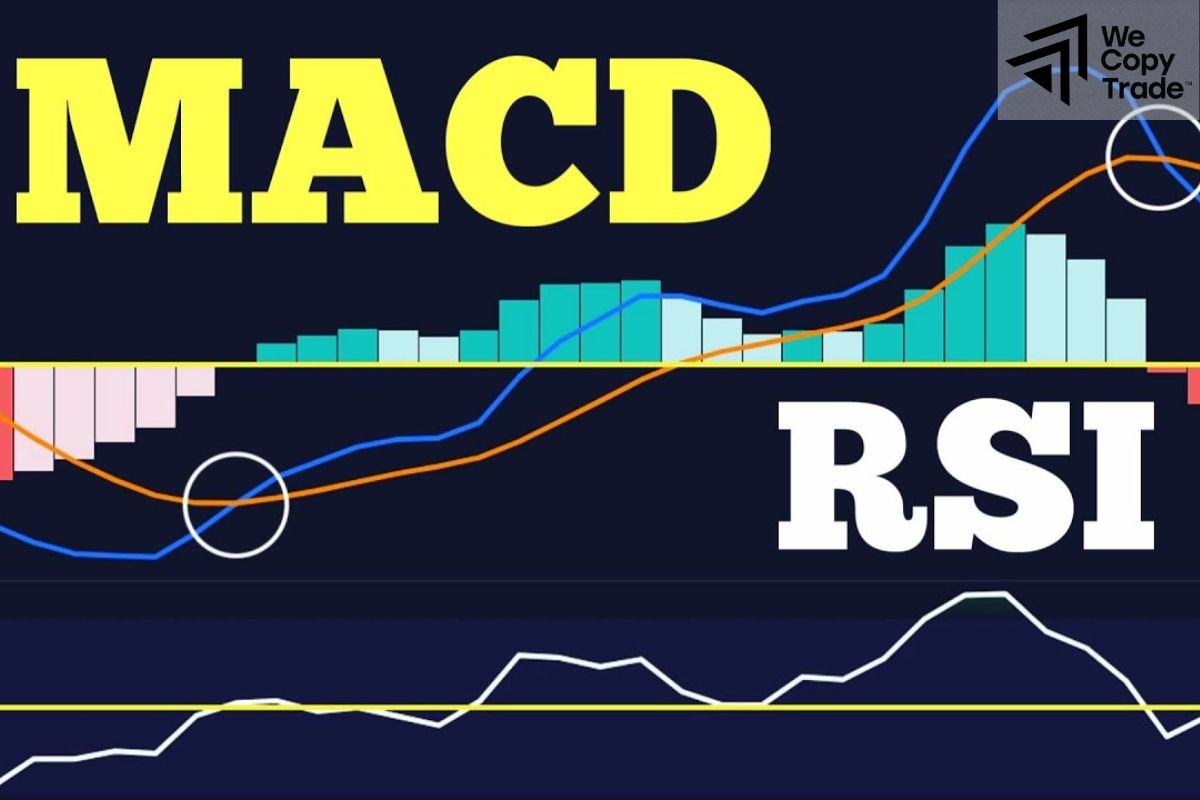
Both RSI and MACD are useful tools in technical analysis to measure market momentum. However, each indicator works differently and provides different information to investors.
- RSI (Relative Strength Index): RSI measures the speed and magnitude of price changes over a period of time. It indicates whether the market is overbought (rising too fast) or oversold (falling too fast). When RSI is above 70, the market is considered overbought and may be about to decline. Conversely, when RSI is below 30, the market is considered oversold and may be about to rise.
- MACD (Moving Average Convergence Divergence): MACD compares two moving averages to measure the trend and momentum of the market. It indicates whether the short-term trend is stronger than the long-term trend. MACD does not have specific overbought/oversold levels like RSI. Instead, investors are interested in the crossover of the MACD and signal lines, as well as the divergence between the MACD and price.
Key differences between RSI and MACD:
- Measurement: RSI measures the rate of change in price, while MACD measures the relationship between two moving averages.
- Overbought/oversold levels: RSI has specific overbought/oversold levels (70 and 30), while MACD does not.
- Information provided: RSI shows the current state of the market (overbought or oversold), while MACD shows the trend and momentum of the market.
Each indicator is strong in its own way, so for the most accurate analysis we should combine the indicators together
How to use MACD in stock trading
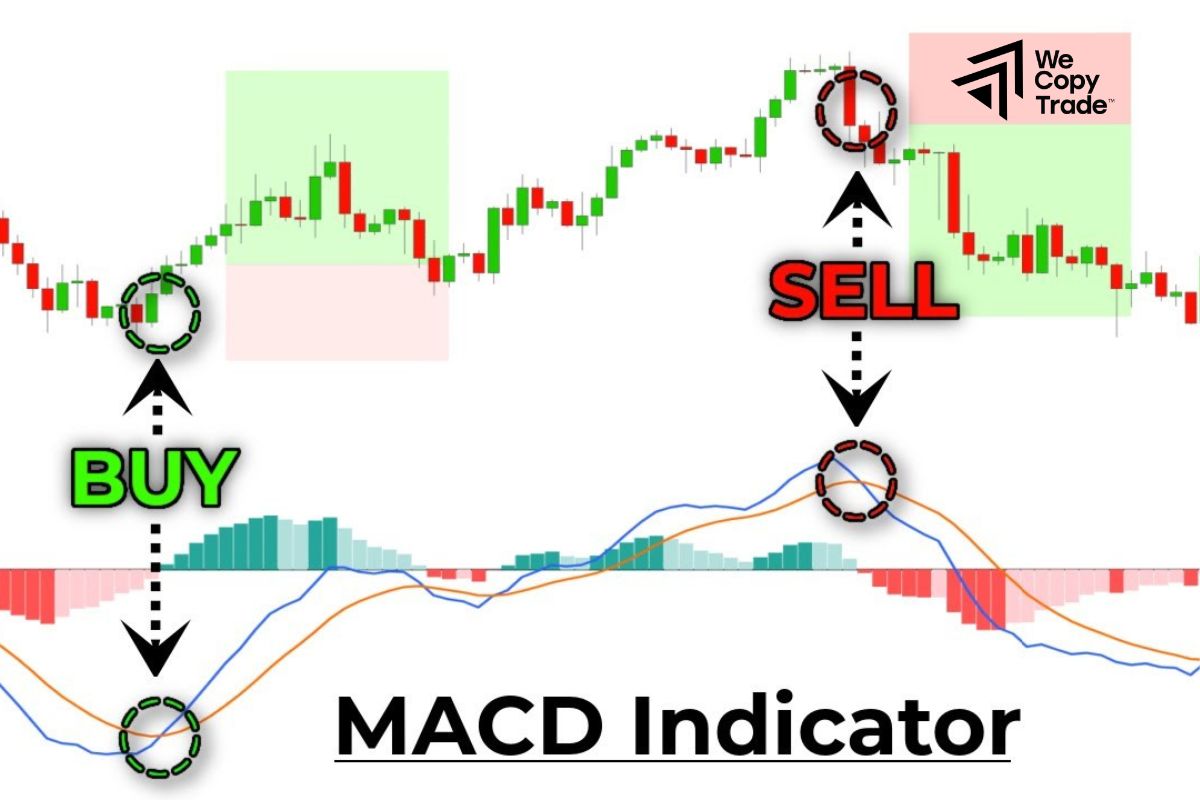
The MACD indicator provides many useful signals for investors to make buying and selling decisions. Here are some common signals:
Buy signal
- Golden cross: When the MACD line (usually green) crosses above the signal line (usually red), it is a signal that the price trend may turn bullish.
- Histogram turns from negative to positive: When the Histogram bar chart turns from red to green, this shows that price momentum is increasing.
- Buy divergence: When the price makes a new low that is lower than the previous low but the MACD line makes a higher low, it is a positive divergence signal and can signal an upward trend reversal.
Sell signal
- Red cross: When the MACD line crosses below the signal line, it is a signal that the price trend may turn bearish.
- Histogram turns from positive to negative: When the Histogram bar chart turns from green to red, this indicates that price momentum is decreasing.
- Negative divergence: When the price makes a new high that is higher than the previous high but the MACD line makes a lower high, this is a negative divergence signal and can signal a downward trend reversal.
Overbought/Oversold Zones
When the MACD line moves too far away from the signal line, it can indicate that the market is in an overbought or oversold condition. This means that the price is likely to correct back to a more reasonable level. However, overbought/oversold zones may vary from stock to stock.
Limitations of the MACD indicator
Here are some limitations when using the MACD indicator that investors need to note:
- False signals: Although divergence and convergence are reliable signals, they are not always accurate. There are cases where the MACD indicator generates false signals, leading to incorrect trading decisions.
- Subjectivity: Each investor may have different ways of setting the parameters of the MACD, leading to different signals. This affects the indicator results.
- Latency: The MACD is calculated based on moving averages, so it often reacts slower than short-term fluctuations of the market. This can cause investors to miss opportunities or enter orders too late.
- Volatile market: During periods of strong market volatility, signals from the MACD may become less reliable, making it difficult to keep up with rapid changes in prices.
Therefore, to make accurate trading decisions, investors should:
- Combine with other indicators: Use MACD in combination with other technical indicators such as RSI, Bollinger Bands to confirm signals.
- Fundamental analysis: Combine with fundamental analysis to better understand the situation of the company and industry.
- Risk management: Always place stop-loss orders to limit losses when trading.
- Accumulate experience: The more trading experience investors have, the better they understand how to use MACD effectively.
Conclusion
In conclusion, MACD indicator is a powerful technical analysis assistant that helps investors identify price trends and make more effective trading decisions. To use MACD successfully, investors need to clearly understand how it works as well as its limitations to combine it with other indicators and carefully analyze the market situation.

