












Have you ever looked at a price chart and seen a pattern that repeats itself over and over again? That’s what technical analysts call harmonic trading. So what is this trading and how does it affect the market? In this article, I will show you the simplest ways to identify and effectively apply this strategy in your trading.
What are harmonic patterns?
Harmonic wave patterns are special shapes made up of highs and lows on a price chart. They are used to predict what might happen to prices in the future, such as whether they will increase, decrease, or move sideways.
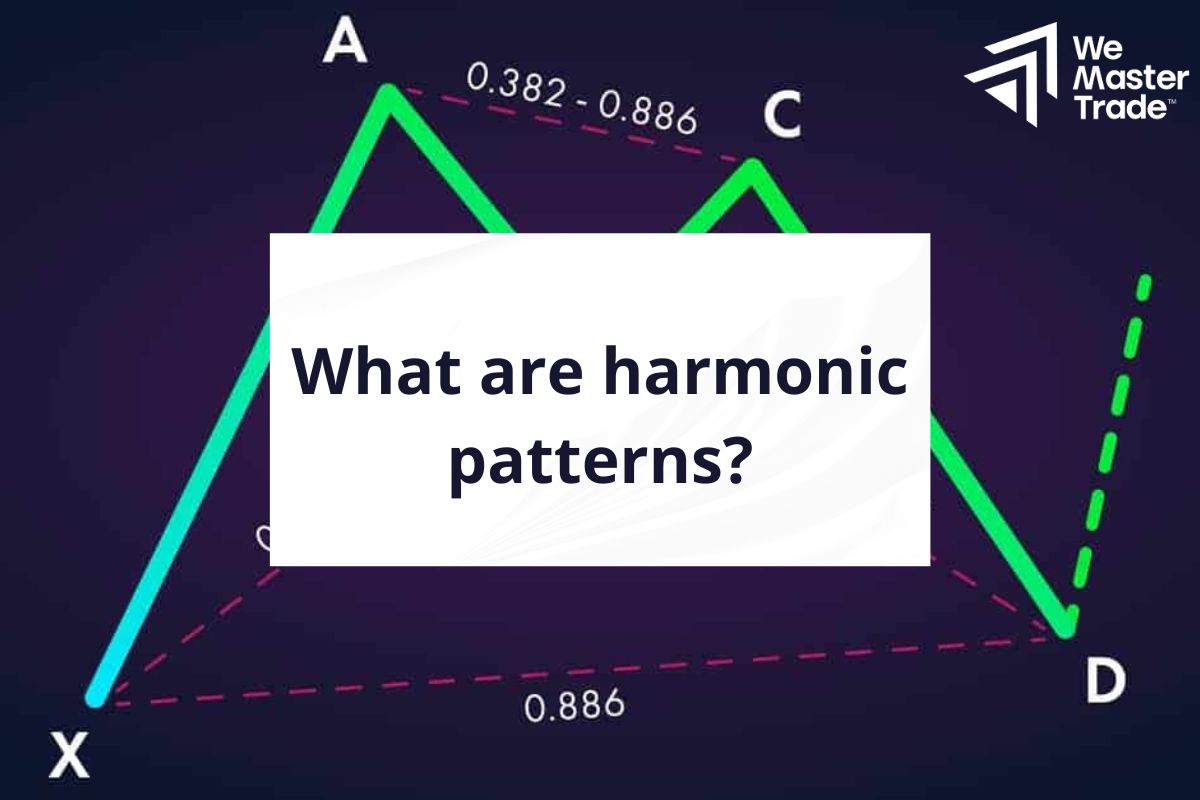
Traders use mathematical tools such as the Fibonacci sequence to identify important points on a chart and draw harmonic wave patterns from there.
Imagine you are looking at a stock price chart. You notice that the price has moved up, then corrected down, and then moved up again. If these highs and lows form a specific shape, like an inverted “M” or “W”, then it could be a harmonic wave pattern.
See now:
- The Power of Trend Confirmation Indicator To Trading Result
- Formula and How to Calculate Debt-to-GDP Ratio Effectively
- What is a Contractionary Policy? Tools Used for Policies
- What Are Trade Wars? Factors of Good or Bad Trade Wars
Top Common Harmonic Trading Pattern
Here are the most common harmonic trading patterns you can refer to to easily recognize and determine the direction of your trading strategy:
ABCD pattern
ABCD is one of the most recognizable patterns. It looks like an inverted “M” or “W” on the chart. The components of this pattern include:
- AB: The initial wave, which can be an uptrend or a downtrend.
- BC: The corrective wave, which usually goes against the AB wave and is about 61.8% of the length of AB (according to the Fibonacci sequence).
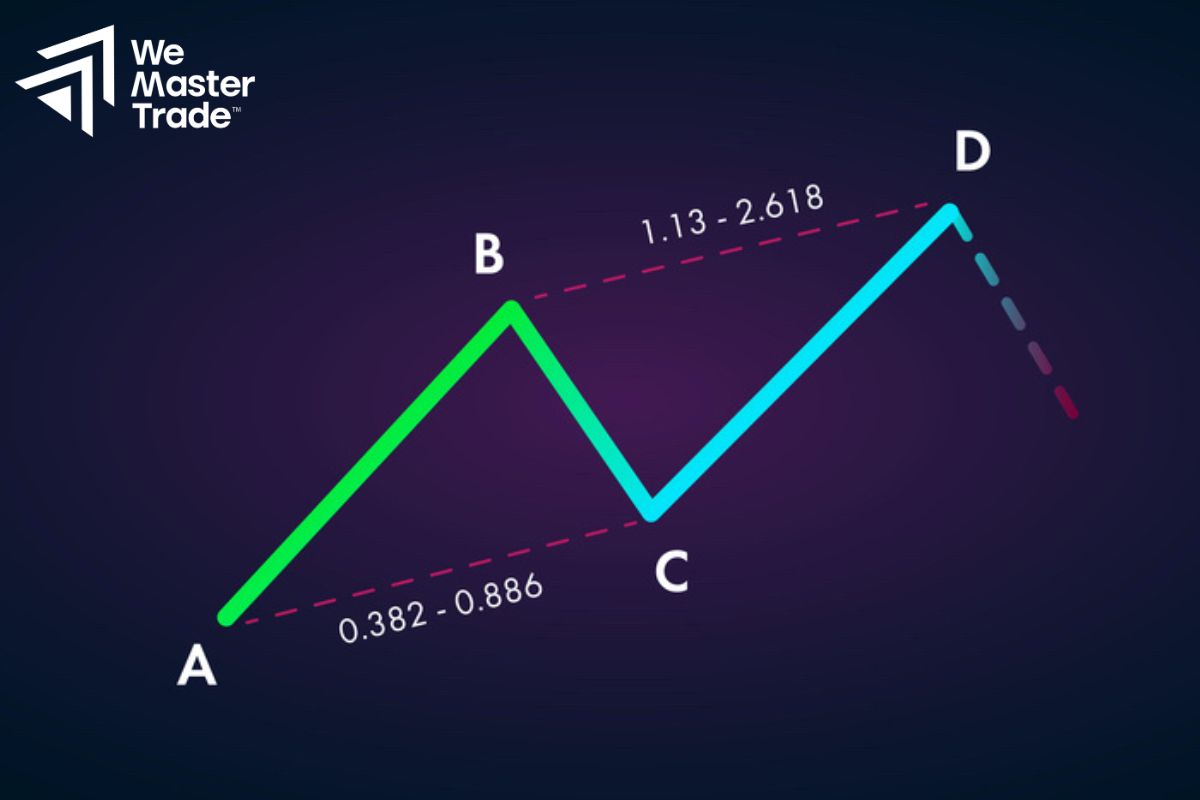
- CD: The final wave, which usually has the same direction as the AB wave, with the same time and length as the AB wave.
- Point C: The potential reversal zone (PRZ), this is the point where traders often place orders.
BAT pattern
BAT has an additional X point compared to the ABCD pattern, forming a bat-like shape.
Components:
- XA: The initial wave.
- BC: Corrective wave, usually reaching 50% of XA.
- XD: Extended wave, usually 1.618 to 2.618 times longer than BC.
- Point D: Potential Reversal Zone (PRZ).
Gartley Pattern
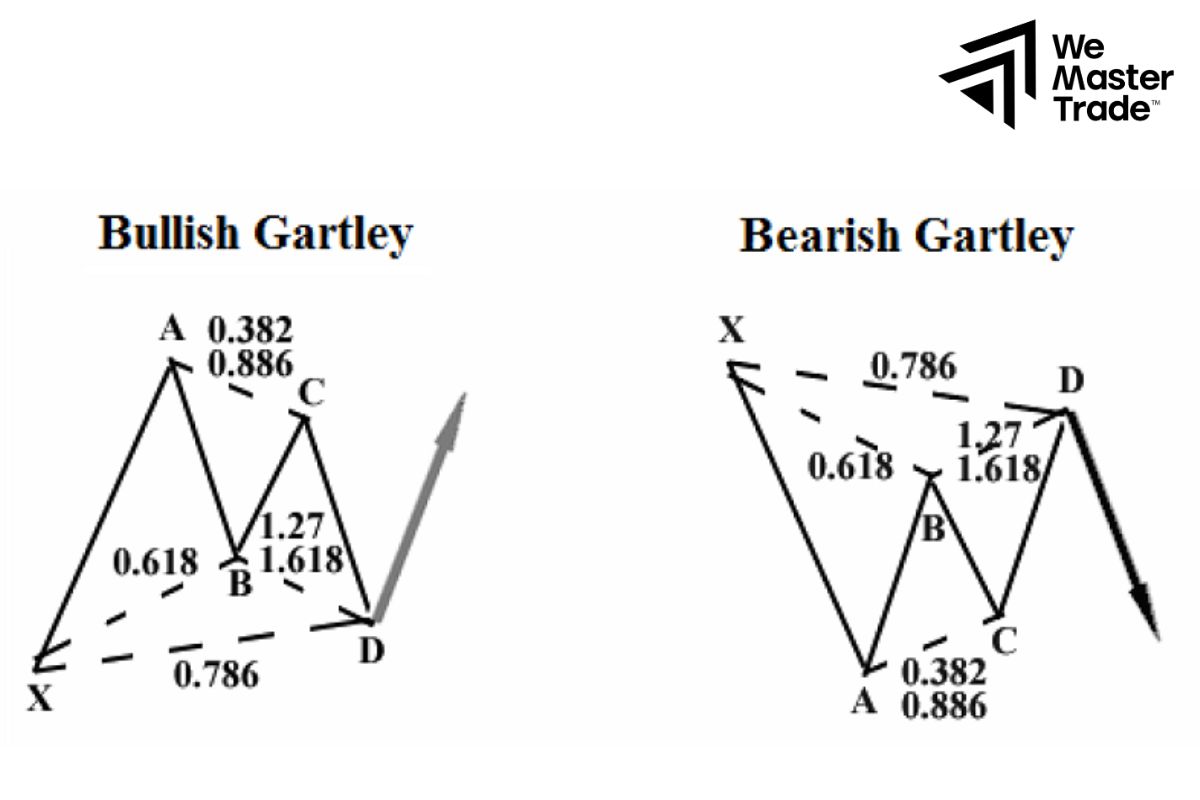
The Gartley pattern, named after the technical analyst H.M. Gartley, is one of the most popular harmonic trading patterns. It is based on Fibonacci levels and can predict potential reversal points in the market.
Key features:
- Point B must retrace exactly 61.8% of the XA segment.
- Point D usually retraces 78.6% of the XA segment.
- Potential Reversal Zone (PRZ) is usually located around point C.
- Entry point: Near point C (PRZ).
- Stop Loss: Placed at point X.
- Take Profit: Usually placed at a Fibonacci extension level from point D.
When the Gartley pattern forms, traders can anticipate a reversal of the current trend.
Butterfly Pattern
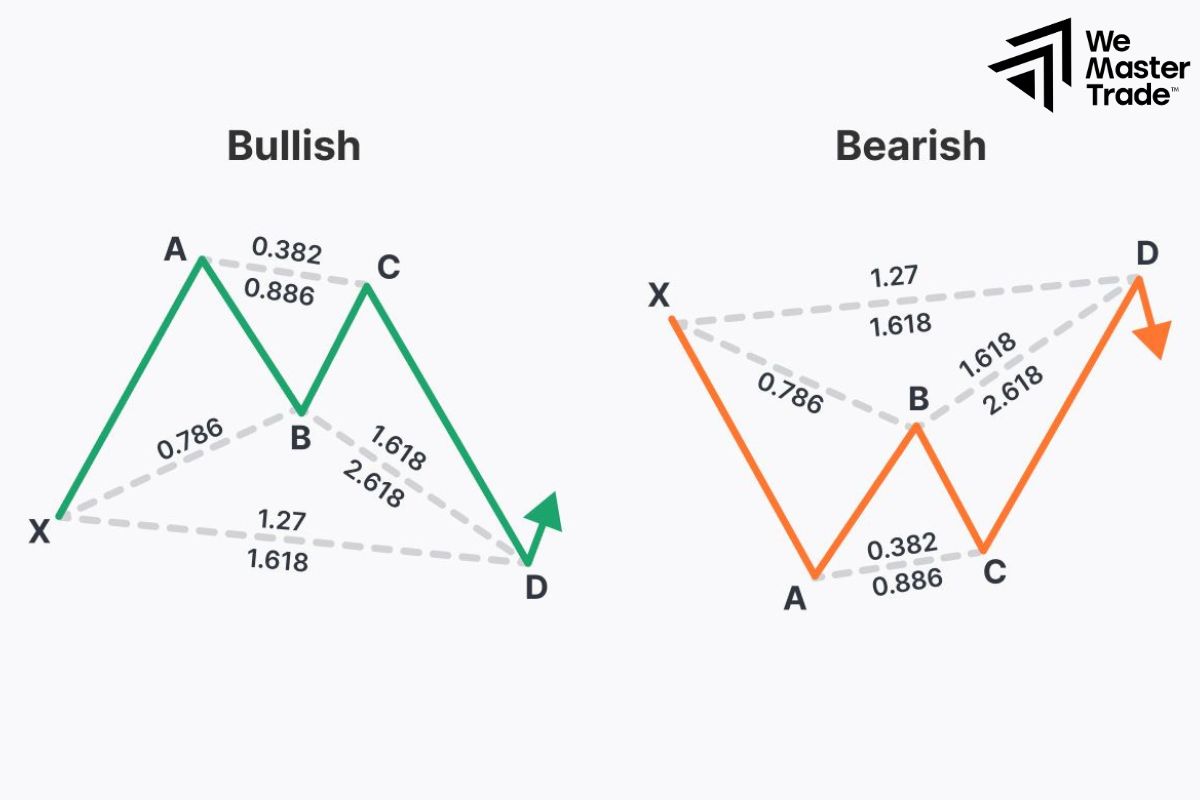
The Butterfly Pattern, discovered by Bryce Gilmore, is another popular harmonic trading pattern. It is similar in structure to the Gartley pattern but with some variations in Fibonacci ratios and is also used to predict reversal points.
Key features:
- Point B must retrace exactly 78.6% of the XA segment.
- Entry point is near point D (PRZ).
- Stop loss: Usually placed at a point slightly below the PRZ.
- Take profit: Usually placed at a Fibonacci extension from point D.
- Potential reversal zone (PRZ) is usually located around point D.
Crab Pattern
The Crab Pattern, discovered by technical analyst Scott Carney, is one of the more complex but also more potent harmonic trading patterns. It is so named because its shape on the chart resembles a crawling crab.
Key Features of the Crab Pattern:
- This pattern consists of four legs: XA, AB, BC and CD, forming a rather distinctive shape.
- Fibonacci ratios: Like other harmonic trading patterns, the Crab also uses Fibonacci levels to identify key points. In particular, the 1.618 level of XA is important in identifying potential reversal zones.
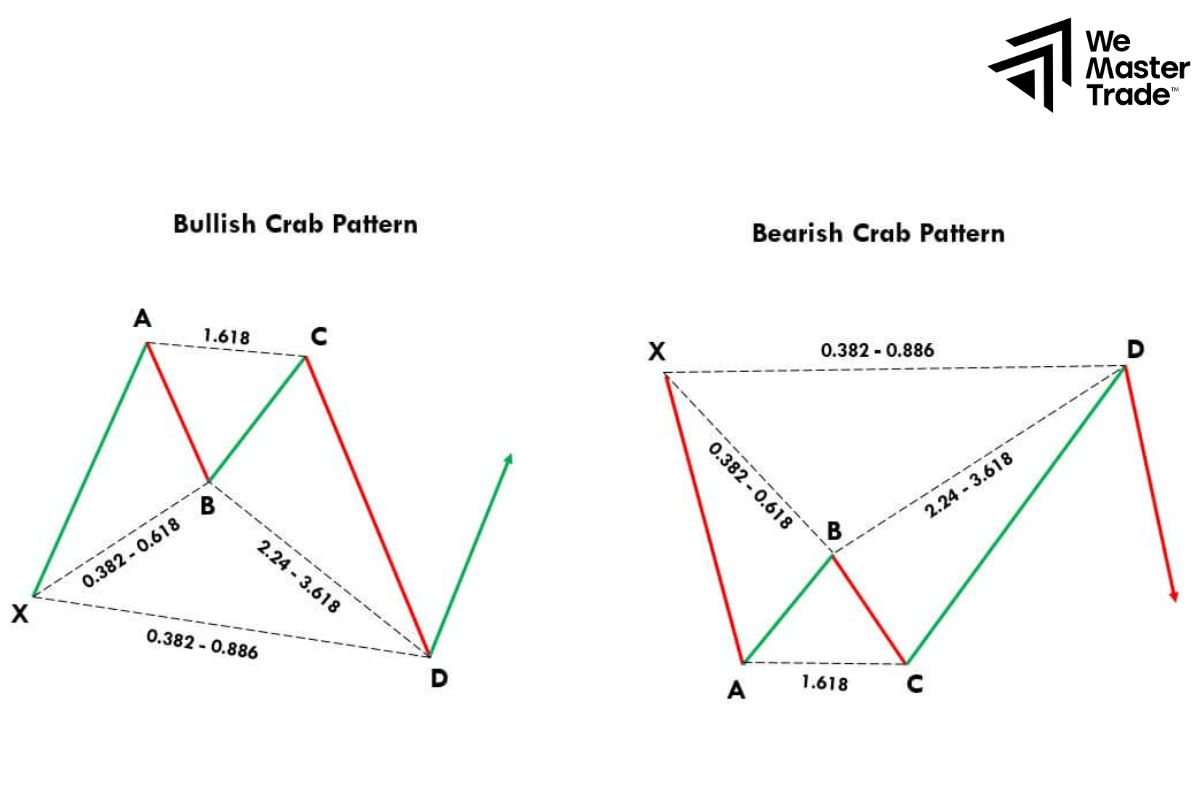
- Potential Reversal Zone (PRZ) is the area where the price is most likely to reverse, usually located at the end of the CD leg.
Formation:
- Bullish version: Price rises sharply from X to A, then corrects slightly towards B (about 38.2% to 61.8% of XA). Next, the price rallies again, breaking through the 1.618 level of XA, forming point D.
- Bearish version: In contrast to the bullish version, the price rallies from X to A, then corrects slightly to B, and finally rallies again to form point D.
Deep Crab Pattern
This is a variation of the Crab pattern, with the main difference being the retracement of point B. In the Deep Crab pattern, point B must retrace 88.6% of XA. This makes the pattern appear deeper and often provides greater trading opportunities.
The Crab pattern can help traders predict major reversals in the market. The PRZ zone provides a clear entry point with a high probability of success.
However, the Crab pattern is one of the most complex harmonic trading patterns, requiring traders to have in-depth knowledge of technical analysis and trading experience. To make it easier to succeed, traders should combine the Crab pattern with other technical analysis tools to increase the reliability of the trading signal.
Shark Pattern
The Shark pattern, another discovery by technical analyst Scott Carney, is one of the most complex and powerful harmonic patterns. It is named so because its shape on the chart resembles a shark hunting its prey.
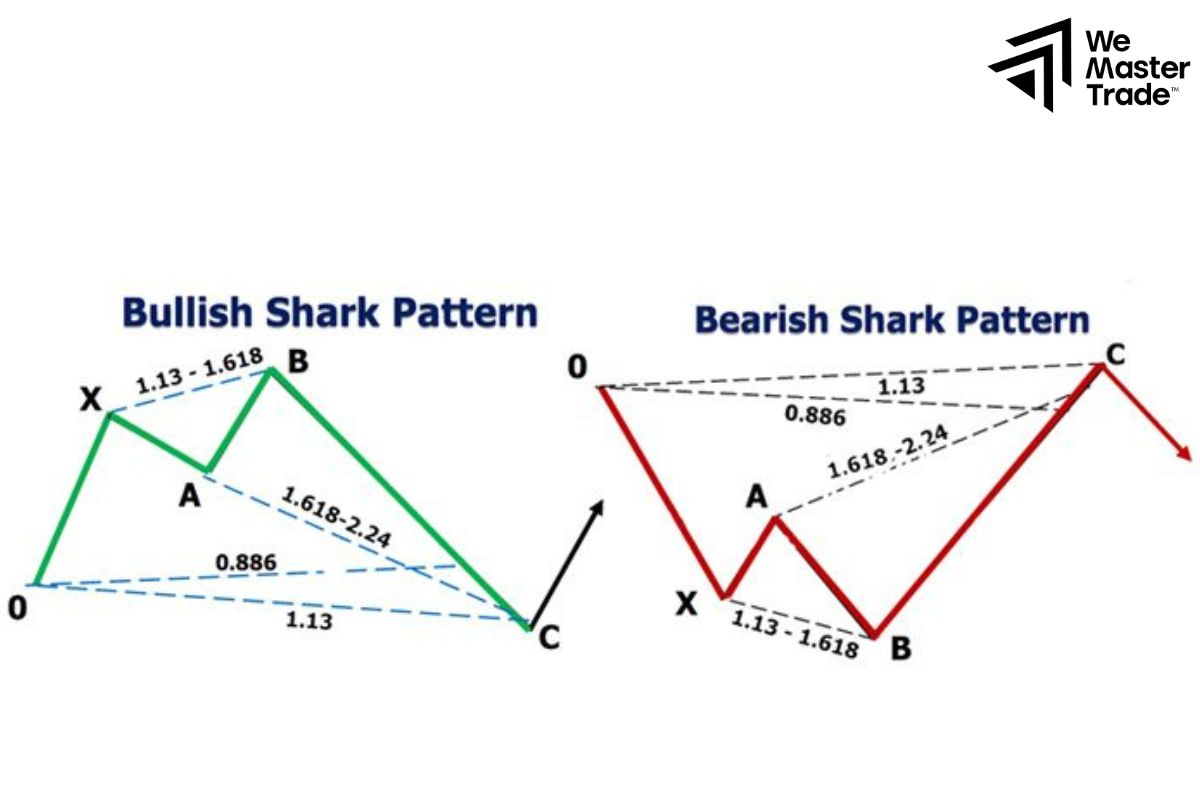
Key features of the Shark pattern:
- The pattern consists of 5 legs: O, X, A, B and C.
- Fibonacci ratios, like other harmonic trading patterns, the Shark also uses Fibonacci levels to identify important points. These ratios create a special geometric structure on the chart.
- Potential Reversal Zone (PRZ) is usually located around point C.
The Shark pattern is formed through a series of price waves, each wave has a specific Fibonacci ratio compared to the previous wave. These ratios create a special geometric structure, resembling a shark hunting its prey.
The Shark pattern is very effective in predicting major reversals in the market. Point C is often a very good entry point, with a high win rate. Due to the strong reversal nature of the pattern, trades based on the Shark pattern often yield very large profits.
How to identify and draw Harmonic Trading
Here is a step-by-step guide to confidently identify harmonic trading patterns and predict potential reversal points
1. Understanding Fibonacci Levels
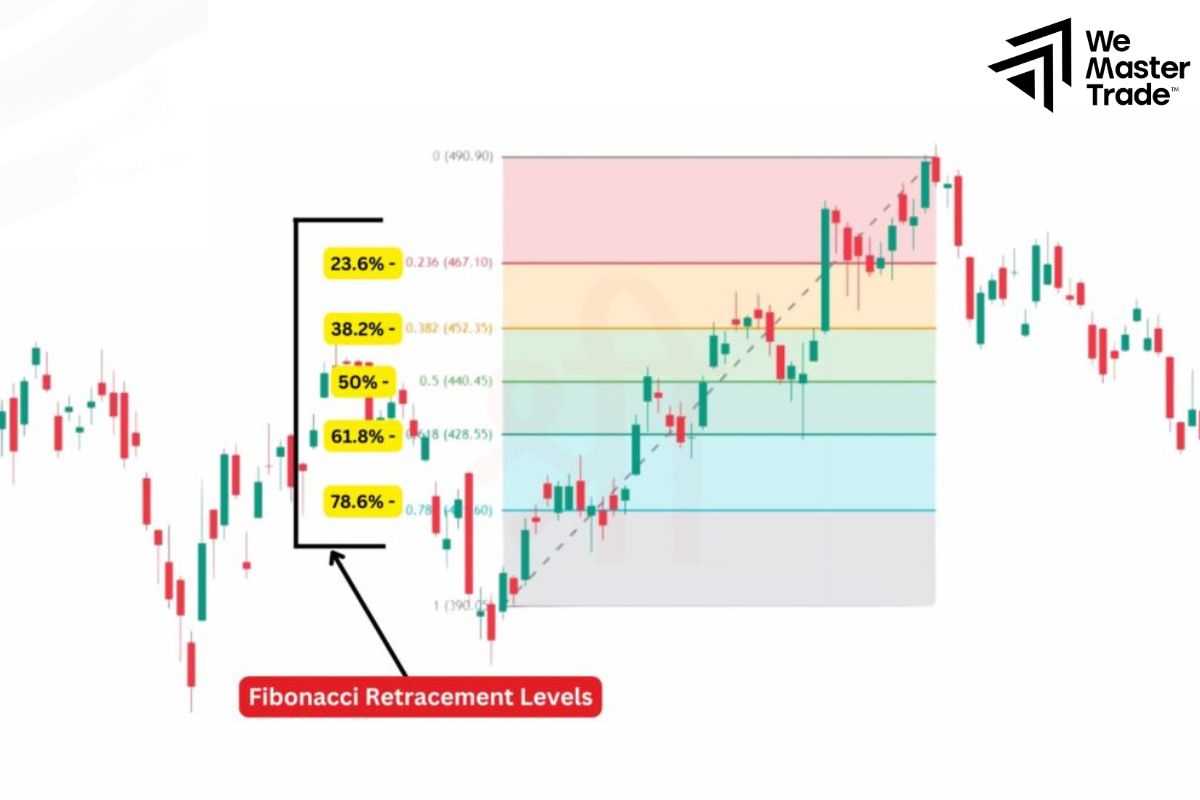
Fibonacci retracements are used to identify potential support and resistance levels in a trend. Common levels include 23.6%, 38.2%, 50%, 61.8%, and 78.6%.
Fibonacci extensions are used to predict price targets after a trend reverses. Common levels include 1.272, 1.618, 2.618.
2. Identifying key points in the pattern
Point X: The start of the trend.
Point A: The end of the first wave and the start of the correction.
Point B: The end of the correction.
Point C: The start of the final wave.
Point D: The end point of the pattern and the expected price target.
3. 3 Steps
- Draw a trendline: Connect points X and A to form a trendline.
- Apply Fibonacci levels:
- Point A: Located at one of the Fibonacci retracement levels of XA (e.g. 61.8%).
- Point B: Located at one of the Fibonacci extension levels of AB (e.g. 1.618).
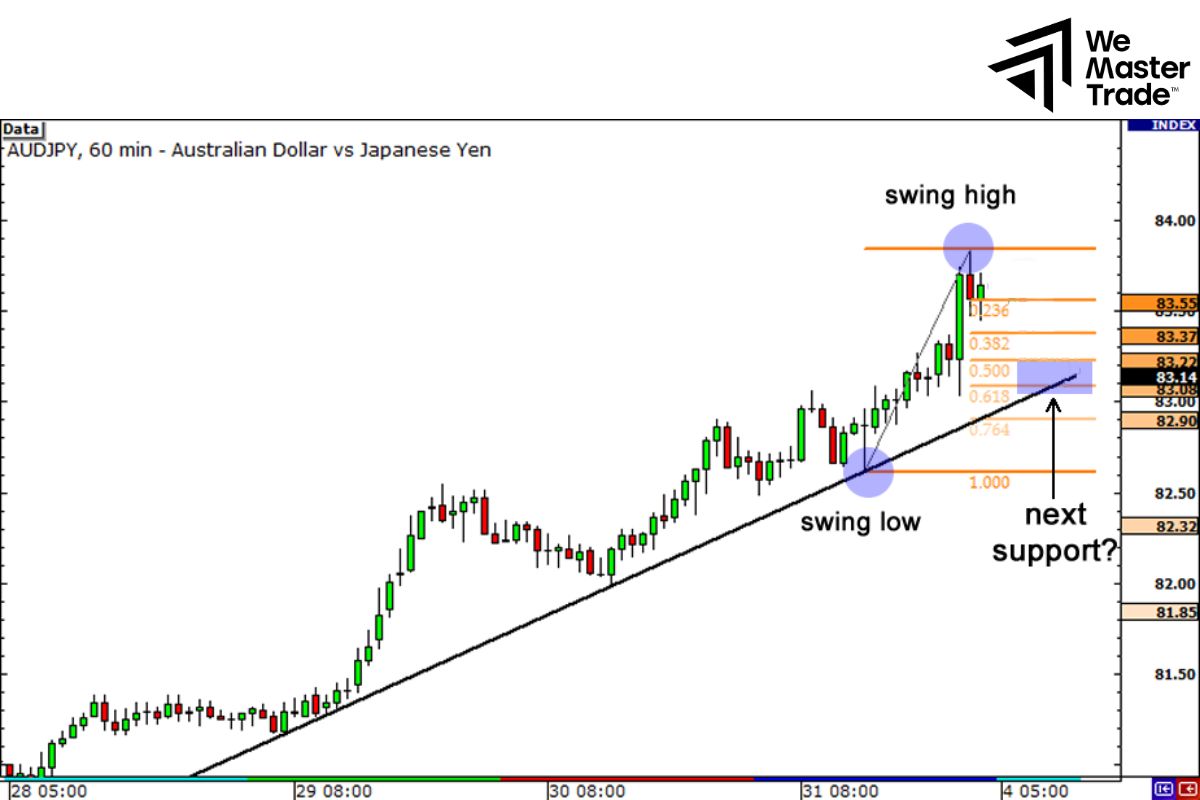
- Point C: Located at one of the Fibonacci retracement levels of BC (e.g. 38.2%).
- Point D: Located at one of the Fibonacci extension levels of CD (e.g. 1.272, 1.618).
- Determine PRZ: The Potential Reversal Zone (PRZ) is usually located around point D.
- Confirm the pattern: Check that the Fibonacci levels match points A, B, C, and D exactly. Additionally, you can use other technical analysis tools such as candlestick charts, RSI, MACD indicators for further confirmation.
Conclusion
In conclusion, harmonic trading is considered a reliable alarm bell that helps investors take advantage of opportunities and limit risks when the market fluctuates. However, to truly use this strategy effectively, always equip yourself with full knowledge, experience and patience. Good luck!
See more:





