












Have you ever felt uncertain about whether to make a trade or not? That’s when you need confirmation. In the world of trading, trend confirmation indicator is a very important concept, helping you increase your confidence in your decisions. Let’s learn how to confirm signal before trading right away.
What is a Trend Confirmation Indicator?
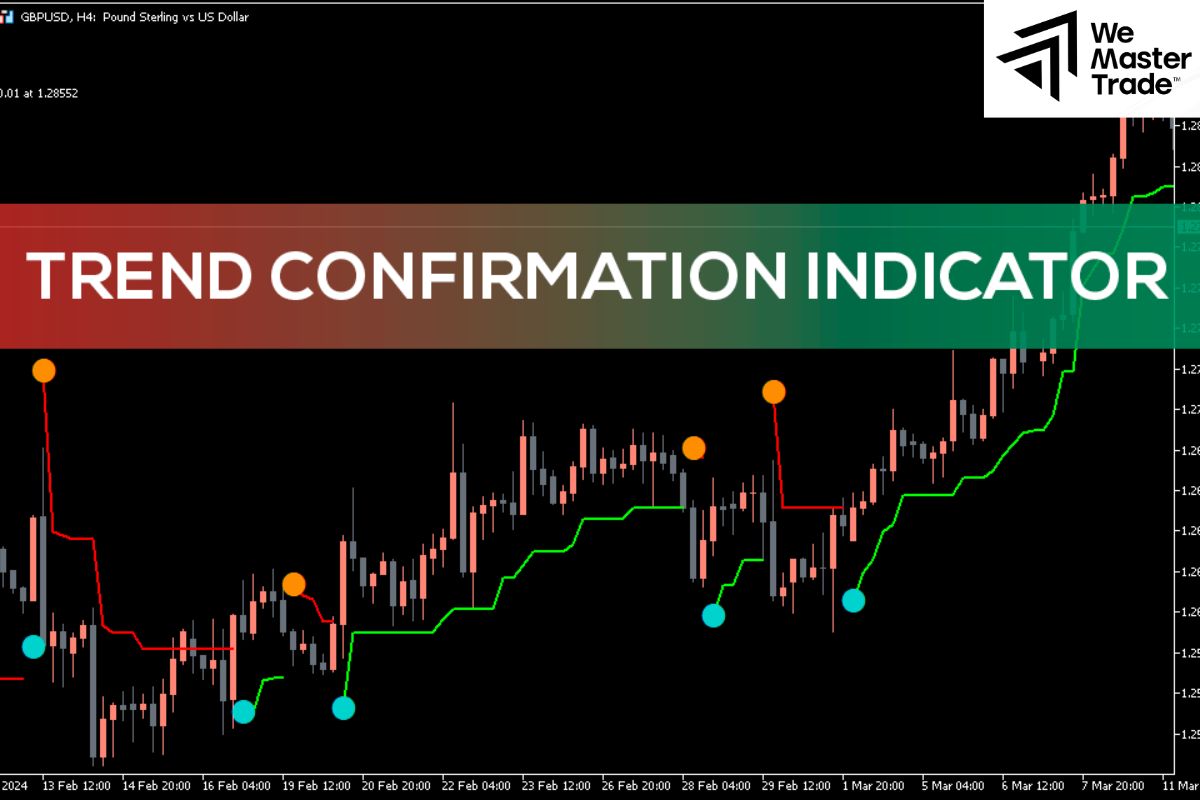
In trading, confirmation is simply understood as you are looking for more evidence to prove a trading signal you have received so that you can make the most accurate trading decision.
Confirmation helps you eliminate false signals and minimize the possibility of losses. When many different indicators give the same signal, you can be more confident that the market is moving in that direction.
See now:
- How Foreign Currency Effects Impact Different Sectors
- List of Top Reliable Safe Haven For Beginning Traders
- Learn How Forex Traders Are Taxed and Their Tax Obligations
Types of Trend Confirmation Indicator
There are many different types of confirmation indicators, but in this article, we will look at some of the most popular and useful:
Oscillators
Oscillators help us measure the “temperature” of the market, indicating whether the market is overbought or oversold. Specifically:
- When prices get too high and the oscillator signals overbought, it can be a sign that an uptrend is about to end and a downtrend may begin. Similarly, when prices fall too low and the oscillator signals oversold, it can be a sign that a downtrend is about to end and an uptrend may begin.
- If the price is rising and the oscillator is also rising, it is a strong signal that the uptrend is continuing.
Types of Oscillator Signals
- Convergence: When the price and the oscillator move in the same direction, we call it convergence. This trend confirmation indicator shows that the trend is getting stronger.
- Divergence: When the price and the oscillator move in opposite directions, we call it divergence. This may indicate an impending trend reversal.
- Signal Line Crossovers: Many oscillators have a signal line. When the price line crosses the signal line, it can be a buy or sell signal.
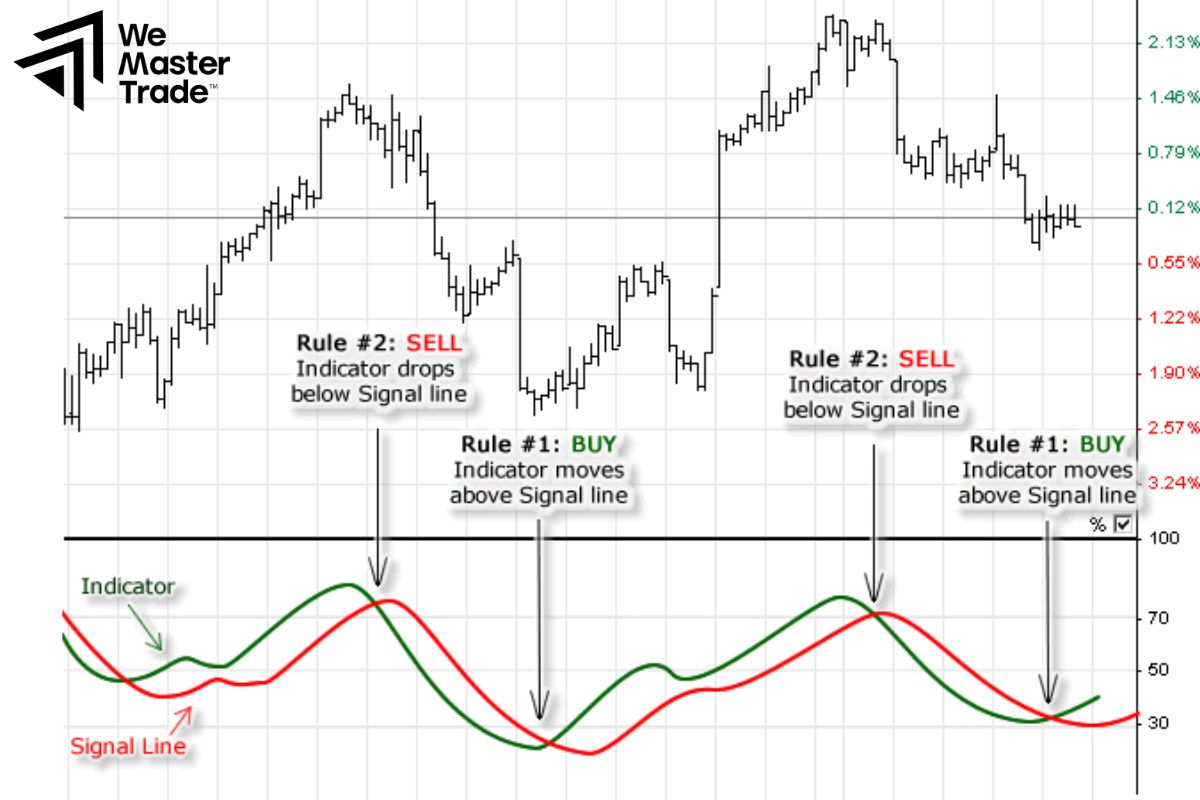
- RSI (Relative Strength Index): The RSI is like a thermometer, measuring the “fever” of the market. When the “temperature” is too high (RSI above 70), it means that the market is too hot and may be about to cool down. Conversely, when the “temperature” is too low (RSI below 30), it means the market is too cold and may be about to warm up.
- Stochastic Oscillator: Compares the current closing price with the price range over a certain period of time.
- MACD (Moving Average Convergence Divergence): MACD helps you determine the direction of the market. When the compass needle points up, it means the price is trending up. Conversely, when the compass needle points down, the price is trending down. A very valuable sign from MACD is when the MACD histogram bars are long and thick, which shows that the trend is very strong.
Volume
Volume is an important trend confirmation indicator that helps us determine the strength of the trend and false signals:
- When the price increases and the volume increases, it is a very strong signal that the uptrend is strengthening. Conversely, if the price decreases and the volume increases, there may be a large force selling and the downtrend may continue.
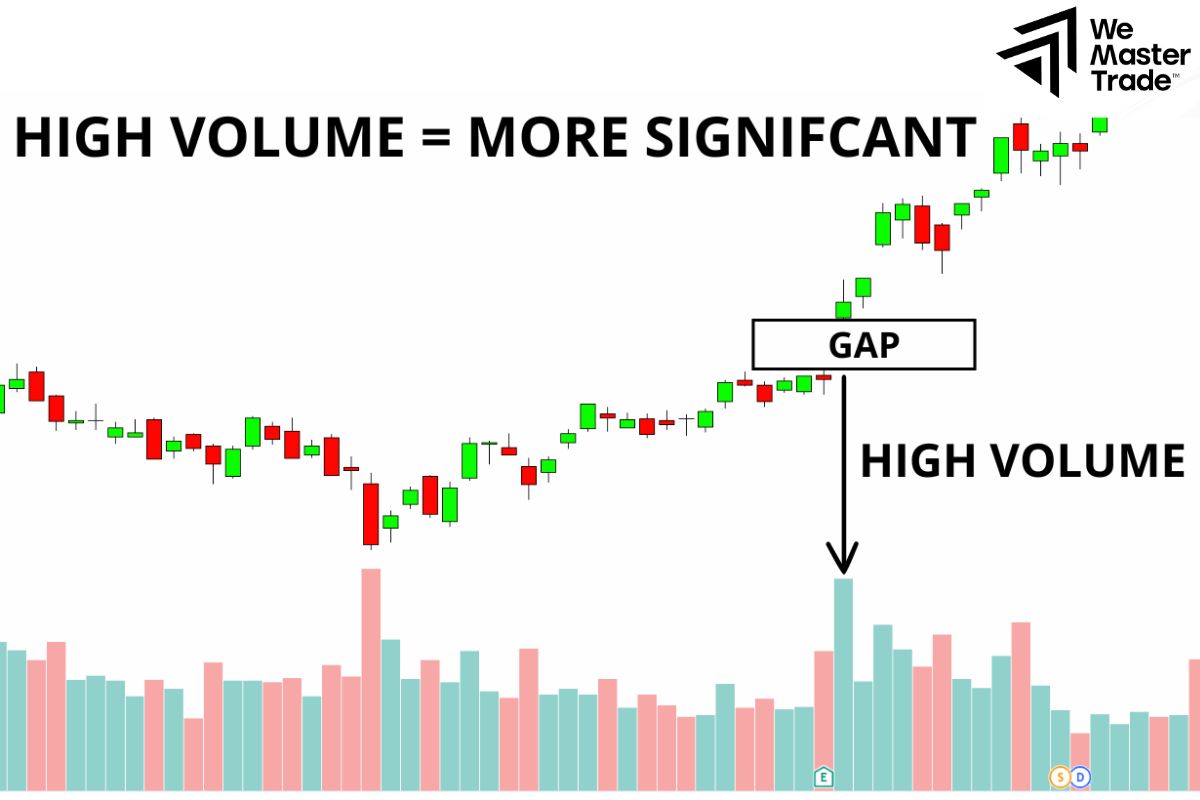
- Sometimes, the price can create false moves, but the volume will help us distinguish between real and false signals. If the price increases sharply but the volume decreases, it may be a false signal and the uptrend may soon reverse.
Trendline
A trendline is a straight line connecting the highest or lowest points on a chart. It helps us to clearly determine the current trend of the market, whether it is up, down or sideways. When the price breaks the trendline, it can be a signal that the trend is reversing.
Fibonacci retracements
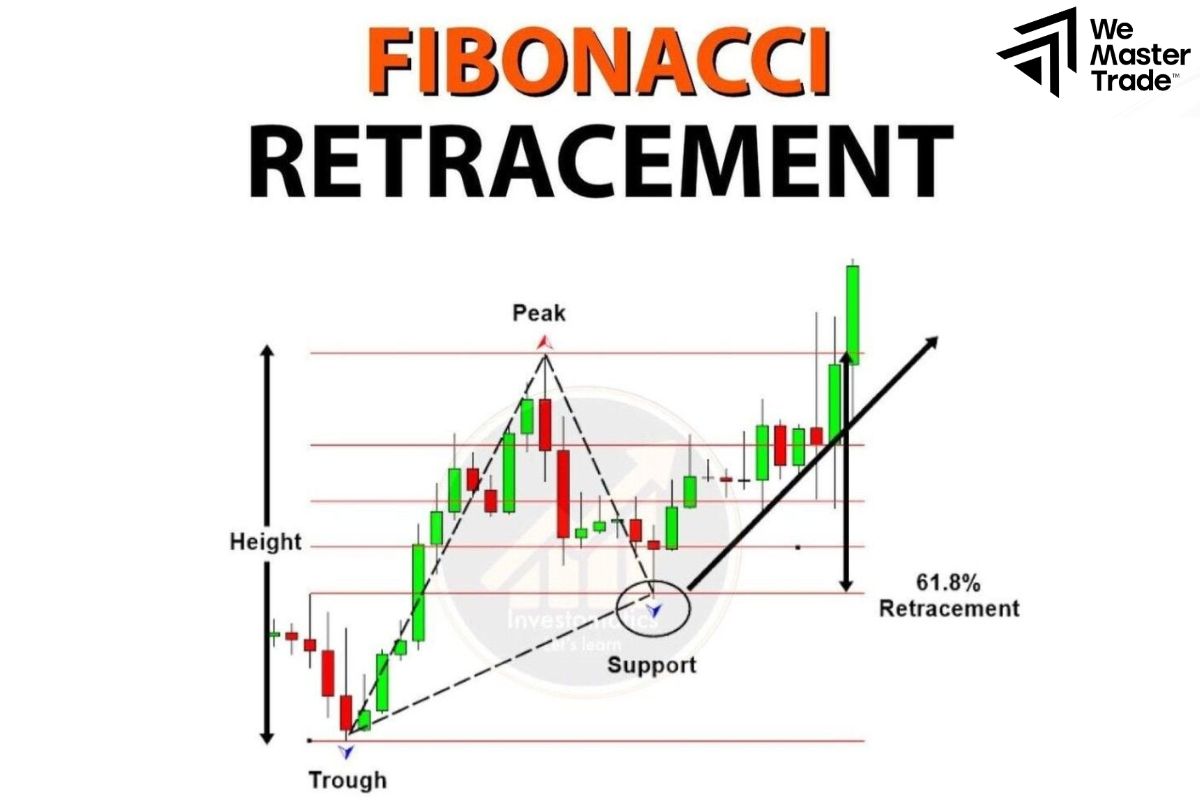
Fibonacci retracements are like milestones on a long road. When price moves a long distance, it will often stop to “recover” at these milestones before continuing its journey. When price stops and bounces back from Fibonacci milestones, it is a sign that the trend is still strong.
Breaking a Trendline
A trendline is like a wall. If price breaks a trendline to the upside, it can signal the start of a new uptrend. Conversely, if price breaks a trendline to the downside, it can signal the start of a new downtrend.
Moving Averages
Moving averages help you clearly identify the market trend and the support and resistance levels of the price. Specifically:
- Moving averages help us determine whether the market is going up, down or sideways. When the short-term moving average crosses above the long-term moving average, it is a signal that the trend is changing from down to up. Conversely, when the short-term moving average crosses below the long-term moving average, it is a signal that the trend is changing from up to down.
- Moving averages can also act as invisible walls. When the price touches the moving average and bounces back, it is a signal that the moving average is acting as a support or resistance level.
Pitfalls of Using Trend Confirmation Indicator
Confirmation indicators are like companions that help us make investment decisions. However, they also have their limitations. If we rely too much on them, we can make serious mistakes.
Common pitfalls:
- Relying too much on indicators to make decisions without considering other factors such as news, events, or general market sentiment.
- Indicators often reflect what happened in the past, not the present. This can cause us to miss good opportunities or enter trades too late.
- Sometimes, indicators can generate false signals, causing us to make wrong decisions. This is like mishearing a sentence and misinterpreting its meaning.
- Using indicators with default settings that do not match the trading strategy also exposes investors to significant risks.
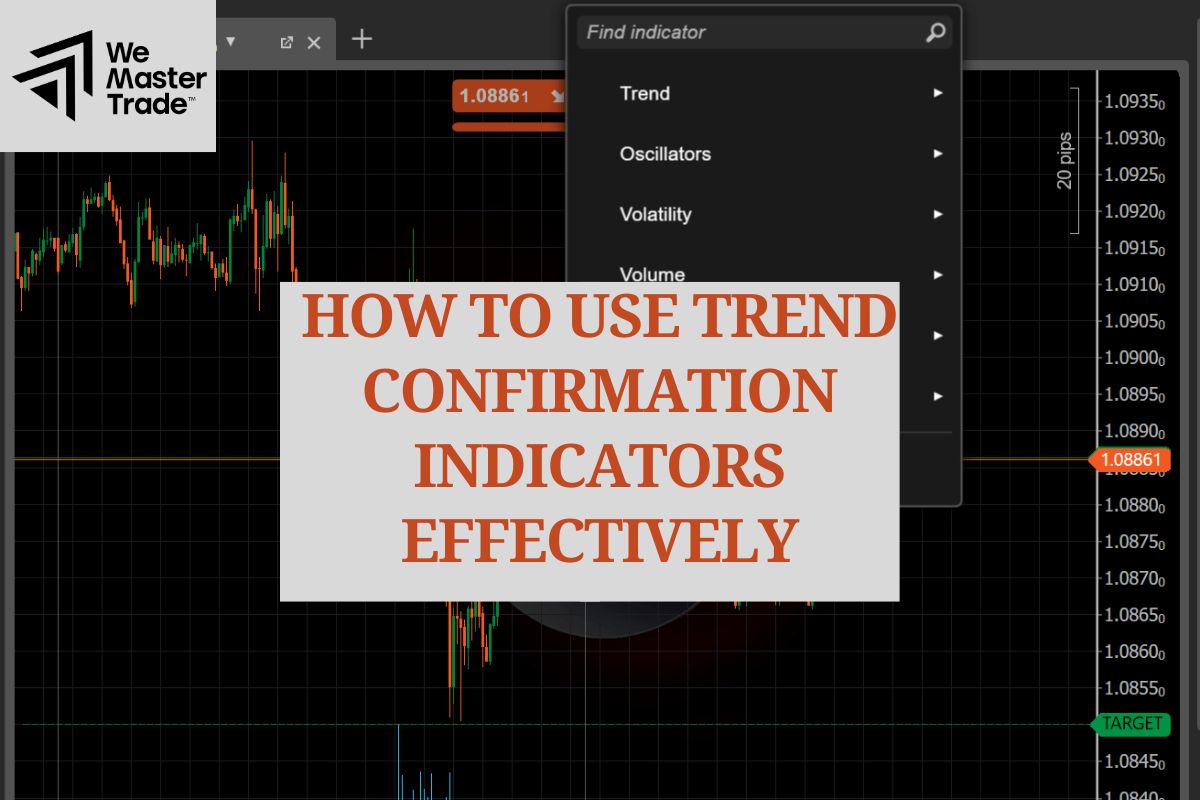
How to use Trend confirmation indicators effectively
- Understand the purpose of each indicator: Each indicator has its own role. Learn about each indicator to understand what type of trading it is suitable for.
- Combine multiple indicators: Don’t rely on just one indicator. For a wider perspective on the market, utilize multiple indicators.
- Customize indicators: Most indicators have customizable parameters. Experiment to find the settings that best suit your trading style.
- Combine with fundamental analysis: Remember that technical indicators are only part of the picture. Combine them with fundamental analysis to get a more comprehensive view of the market.
- Use the right time frame: When using technical indicators, the time frame also plays an important role. If you use a short-term indicator for a long time frame, you may get a lot of noise and it will be difficult to make an accurate decision. When indicators on different time frames give the same signal, you can be more confident in your decision. Each time frame will give you a different perspective on the market.
- Short time frame: for example: 5 minutes, 15 minutes will show you short-term price fluctuations. Indicators like Stochastic Oscillator will work well on this time frame.
- Long time frame: for example: daily, weekly will show you the general trend of the market. Indicators like Moving Average will be more suitable for this time frame.
Let’s say you get a buy signal from the MACD indicator. To confirm this signal, you can check:
- Is the price breaking an important resistance level?
- Is there a spike in trading volume?
- Is the RSI in oversold territory?
- Are other indicators giving similar buy signals?
If all of the above factors support a buy signal, you can be more confident in opening a buy position.
Conclusion
In conclusion, trend confirmation indicator is an extremely useful tool for investors to check the effectiveness of their strategies. However, any tool has certain advantages and disadvantages. To easily succeed in trading, you should combine them with your knowledge and experience. Good luck!
See more:





