













Behind the success of investors is certainly not only luck. They hold in their hands the acumen and flexibility in using technical indicators. Discover the hidden corners of RSI that you never knew. This article will help you improve your technical analysis skills and make more accurate investment decisions.
What is RSI?

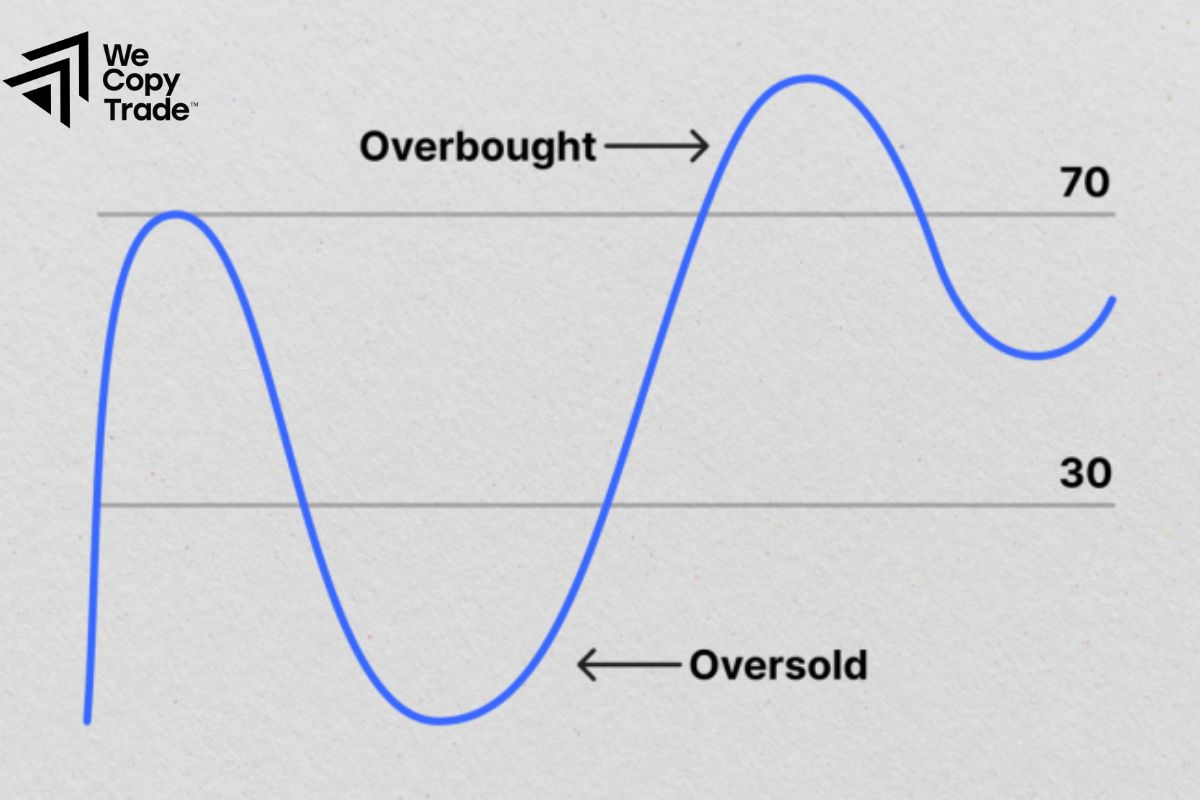
The relative strength index is a useful measurement tool that shows the rate at which a stock’s price has increased or decreased over a period of time. When the RSI reaches 70 or above, it indicates that the stock is overbought and may be about to decline. Conversely, if the RSI falls below 30, the stock may be oversold and may be about to rise again.
Not only does it help investors identify potential buying and selling points, the RSI is also a powerful tool in detecting market reversal signals. However, to make informed investment decisions, investors should combine the RSI with other technical indicators and fundamental analysis.
See now:
- Guide Step By Step How To Become A Successful Trader
- How To Start Learning Technical Analysis Before Trading?
- The 5 Best Momentum Indicators to Analyze Trend Strength
- Top 7 Best Volatility Indicators in the Market Updated 2024
How the RSI Works
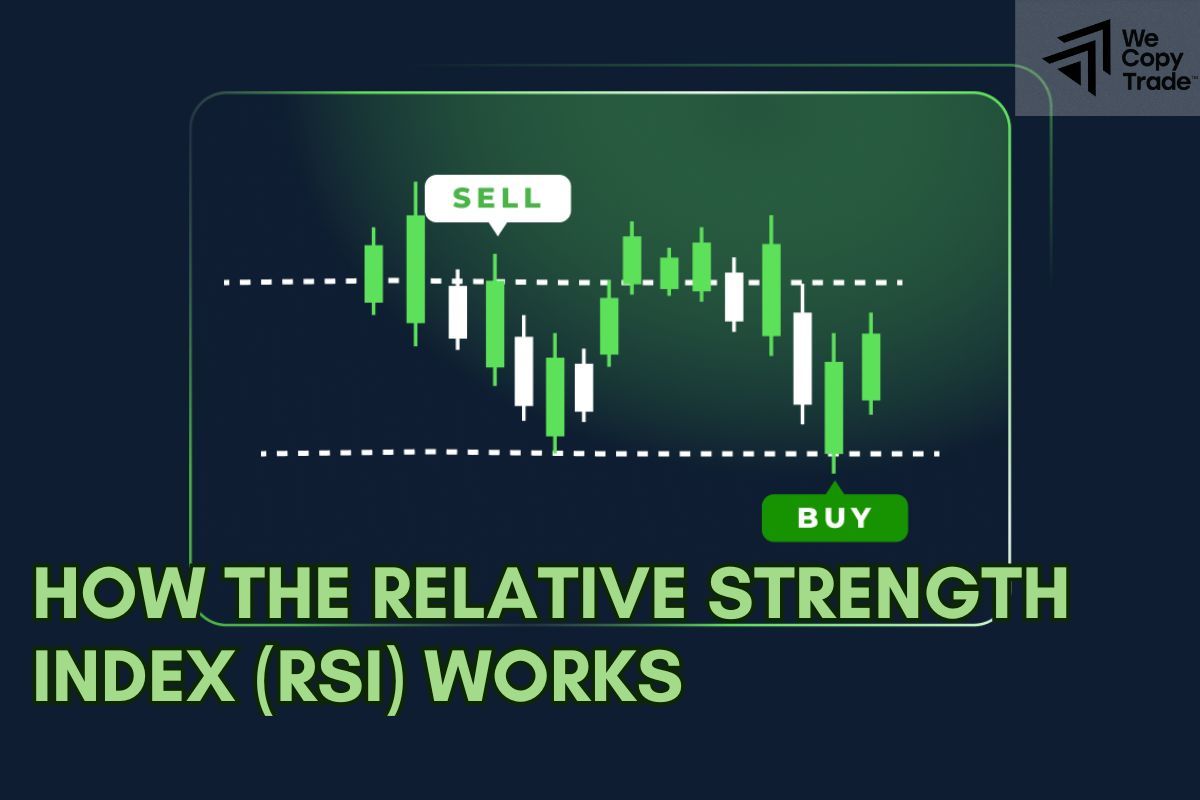
RSI compares the “upward momentum” to the “downward pressure” of a stock over a period of time. This gives us a sense of whether a stock is being bought or sold.
The RSI compares the buying and selling of stocks.
When the RSI is high, it indicates that the stock is being bought heavily and may be nearing a peak. Conversely, when the RSI is low, it indicates that the stock is being sold heavily and may be nearing a bottom.
Calculating RSI
Calculating RSI is simply comparing the total number of days the stock price has increased to the total number of days the stock price has decreased over a given period of time.
Step 1: Calculate the ratio between the total number of days that have increased in price and the total number of days that have decreased in price over the last 14 days. This will help us see whether the stock is trending higher or lower.
Step 2: Adjust this ratio to get the RSI value based on the formula:
RSI = 100 – [100 / (1 + Average gain over a specified period / Average loss over the same period)]
This step helps us come up with a specific number from 0 to 100, indicating the strength of the current trend. If the RSI is high (above 70), it shows that the stock is increasing very strongly and may be about to slow down. Conversely, if the RSI is low (below 30), it shows that the stock is decreasing strongly and may be about to speed up.
RSI Signals
Overbought and oversold levels
The RSI reflects overbought and oversold levels. When the RSI exceeds 70, we can imagine it as an overstretched bow, which is very easy to slip. This shows that the stock has risen too high and may soon fall in price. Conversely, when the RSI is below 30, the situation is like a compressed spring, just a small force can push it back. This shows that the stock has fallen too deep and may soon rise in price.
Common RSI levels
- RSI 85: The stock is in a state of extreme “supply tension”, the risk of correction is very high.
- RSI 70: The stock is overbought, be careful with the risk of reversal.
- RSI 50: The market is in a state of balance, there is no clear trend.
- RSI 30: The stock is oversold, this may be a good buying opportunity.
- RSI 15: The stock is in extreme “weakness”, with the potential for a strong recovery.
What is overbought?
- When a stock is bought by too many investors in a short period of time, its price will increase very quickly. However, this overheated price increase is often unsustainable. When investors start to take profits and sell, the stock price can fall sharply.
Why are overbought stocks dangerous?

- Correction risk: Stock prices can fall sharply after a rapid increase.
- High volatility: Overbought stocks are often very volatile, making it difficult to predict.
How to deal with overbought stocks:
- Consider selling or shorting: If you are holding this stock, consider selling to lock in profits or shorting to profit from the decline.
- Set a stop-loss order to protect your capital in case the price drops sharply.
- Pay attention to divergence signals: When the relative strength index (RSI) is falling while the price is still rising, it is a warning signal that the uptrend may be coming to an end.
What is oversold ?
When a stock is sold by too many investors in a short period of time, its price will fall very quickly. However, this overheated price drop is often unsustainable. When the selling pressure eases, the stock price can rebound.
Why is an oversold stock an opportunity?

- Potential for recovery: Stock prices can rise sharply after a deep decline.
- Attractive price: Oversold stocks are often priced very attractively compared to their real value.
How to take advantage of oversold stocks?
- Consider buying: If you have enough knowledge and experience, consider buying these stocks.
- Watch for bullish divergence: When the relative strength index (RSI) rises while the price remains down, it is a positive signal that the downtrend may be coming to an end.
- Use limit orders: Place a limit order to buy the stock at the desired price.
The Difference Between RSI and MACD

RSI and MACD are both momentum indicators that are easily confused, but they work differently
- MACD: Measures Market Momentum
Like a car’s speedometer, MACD helps us measure the rate at which a stock price is rising or falling. It is calculated by comparing two moving averages of the price. When the MACD line crosses above the signal line, it is a signal that the price is likely to continue rising. Conversely, when the MACD line crosses below the signal line, the price is likely to fall.
- RSI: Measures Overbought or Oversold Levels
RSI is like a thermometer that helps us measure the “temperature” of the market. When the RSI is high (above 70), it means that the price has risen too fast and may be about to fall. Conversely, when the RSI is low (below 30), it means that the price has fallen too far and may be about to rise.
Both RSI and MACD are powerful tools, but when combined, we get a more complete picture of the market. By comparing the signals of RSI and MACD, we can determine more accurate buy and sell points.
Conclusion
In conclusion, through this article, we have discovered that RSI is one of the powerful tools that helps investors predict market trends. By understanding how these indicators work, you can be more confident in making buying and selling decisions. Are you ready to discover more effective trading secrets?
See more:





