












Do you want to accurately predict what is happening in the market? The ISM Manufacturing Index is an extremely useful tool that helps investors understand the economic situation of a country, thereby making better decisions. Don’t miss the following article, I will help you exploit all the outstanding uses of this indicator.
What Is the ISM Manufacturing Index?
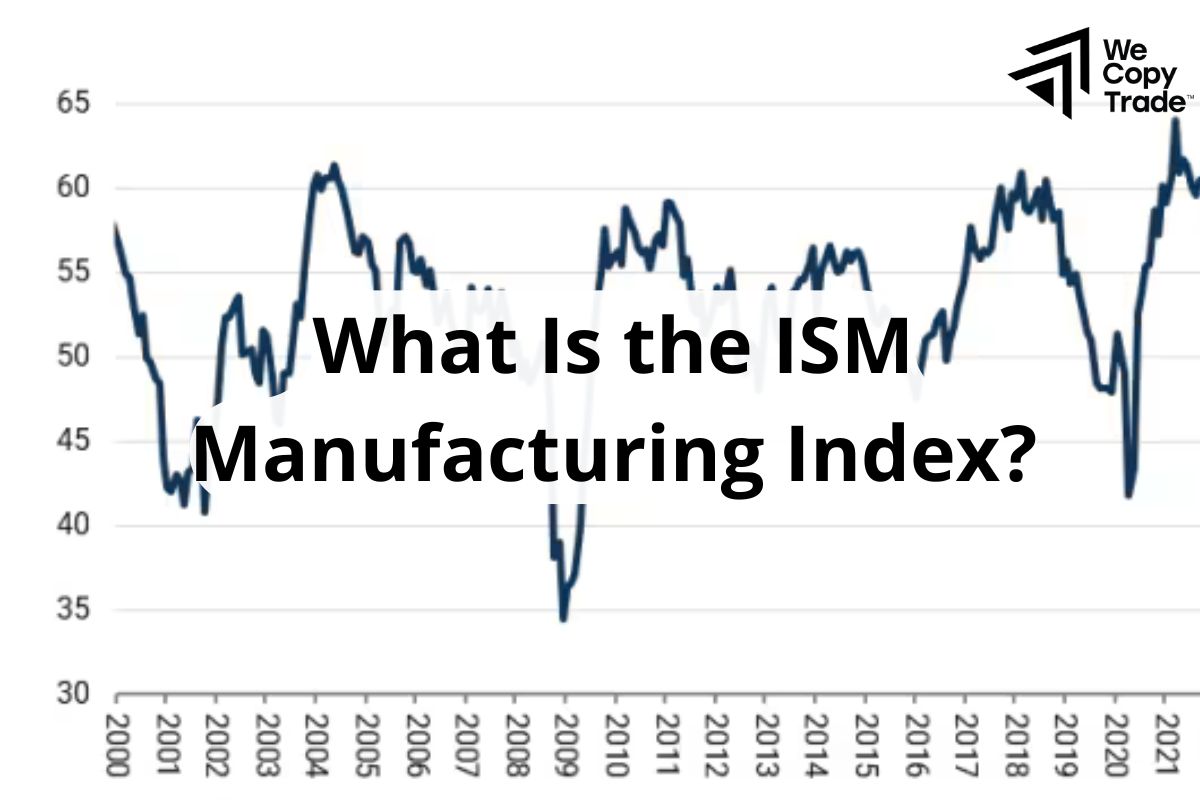
The ISM Manufacturing Index (also known as the Purchasing Managers’ Index – PMI) is an important measure of the health of the manufacturing sector in the United States. It is like a monthly “health report” that shows how well or poorly factories and manufacturing plants are performing.
See more:
- Take advantages Industrial Production Index (IPI) In Trading
- How Do Non-farm Payrolls Impact the Financial Market?
- How Do Unemployment Rates Impact To Market Vodility?
What does the ISM index say?
This index reflects the level of consumers and businesses wanting to buy products. If the index is high, it means that demand is high, factories will produce more.
The ISM index helps us better understand the general economic situation of the United States. When the index is high, the economy is usually in a growth phase. Conversely, when the index is low, the economy may be in difficulty.
Investors and businesses often closely monitor this index to make investment and production decisions.
Meaning of the ISM index:
- An index above 50 shows that the manufacturing industry is expanding.
- An index below 50 shows that the manufacturing industry is shrinking.
For example: If the ISM index is 52, it means that manufacturing activity is growing compared to the previous month.
Uses of the ISM Manufacturing Index
Here are some uses of the ISM indicator, you can refer to take advantage of in your trading decisions:
Market Trend Forecast
Stock Market: When the ISM index rises, it shows that businesses are producing more, increasing revenue. This often leads to higher stock prices. Conversely, when the index falls, the stock market can go down.
Bond Market: When the economy is strong (high ISM index), inflation can increase. Since bond prices usually fall when inflation increases, when the ISM index rises, bond prices can fall.
Evaluating the health of the economy

The ISM index shows how factories and businesses are operating. If the index is high, it means that factories are producing more goods, employing more workers, and the economy is growing.
Conversely, if the index is low, the economy may be in trouble, factories are reducing production, and even having to cut jobs.
Business Decision Guide
- Investors: Based on the ISM index, investors can decide where to invest, whether to buy or sell stocks and bonds.
- Businesses: Manufacturing companies use the ISM index to plan production, forecast sales and make important business decisions.
- Governments: The government uses the ISM index to evaluate the effectiveness of economic policies and make necessary adjustments.
ISM Manufacturing Index Construction
The ISM Manufacturing Index is built on a careful survey and calculation process. To better understand how this index is created, let’s go into detail step by step.
Broad survey of industries

The survey does not focus on just a few specific industries but covers many different sectors of the US economy. These industries are classified according to a standard system to ensure representativeness.
Purchasing managers will be asked about many different aspects of manufacturing activities, from new orders to employment, prices, and many other factors.
Calculating the diffusion index
To assess the growth trend, people compare the number of businesses reporting growth with the number of businesses reporting declines.
The diffusion index is a number that shows the percentage of businesses reporting growth or no change. If the index is higher than 50%, it means that the majority of businesses are growing.
Calculating the Composite Manufacturing Index
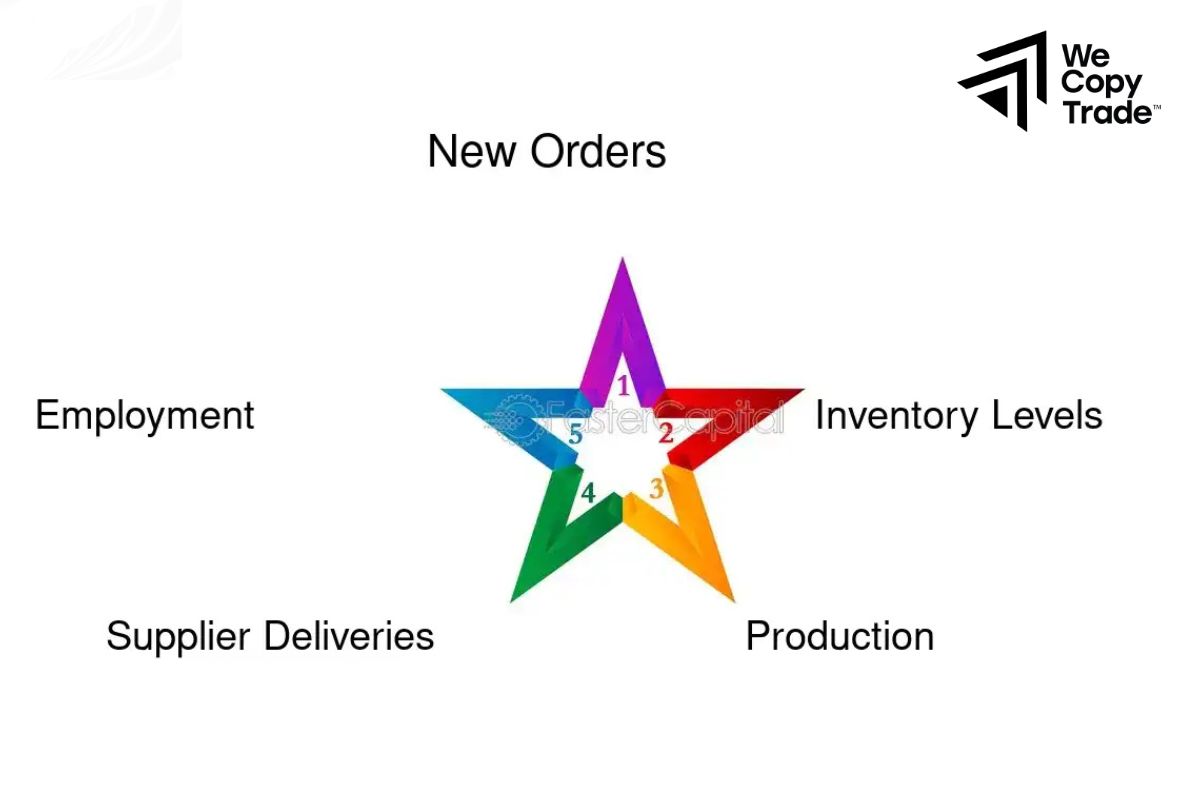
The five main factors including new orders, production, employment, supplier deliveries and inventories are considered with equal importance.
The diffusion indexes of each factor are averaged to give the final composite manufacturing index.
For example, if 60% of businesses reported an increase in new orders, 55% reported an increase in production, and the remaining indicators were similar, the composite manufacturing index would be higher than 50, indicating that the manufacturing economy is expanding.
How Does the ISM Manufacturing Index Impact the Forex Markets?
The ISM Manufacturing Index acts as a “compass” for investors. When this index changes, it affects the stock and bond markets in different ways.
Impact on the stock market
When the ISM index is higher than expected, it shows that the economy is growing strongly, businesses are producing more and making more profits. This often makes investors optimistic and pushes stock prices up.
Conversely, when the ISM index falls, it shows that the economy is struggling, businesses are producing less and profits are falling. This makes investors nervous and sell stocks, causing the stock market to go down.
Impact on the bond market

When the ISM index rises sharply, it can be a sign that inflation is rising. Since inflation reduces the value of money and affects the returns on bonds, when the ISM index rises, bond prices often fall.
When the ISM index falls, inflation concerns also decrease. This can cause bond prices to rise. For example, when the ISM index comes out higher than expected, investors will often buy stocks of manufacturing companies because they expect these companies to do well in the future. Conversely, they may sell bonds to avoid inflation risks.
How is the ISM Manufacturing Index calculated?
The ISM Manufacturing Index is based on a monthly survey of purchasing managers at hundreds of manufacturing companies across the United States.
The calculation process

- Each month, the Institute for Supply Management (ISM) sends a questionnaire to its member companies.
- Purchasing managers answer questions about their companies’ manufacturing performance in areas such as new orders, production, employment, supplier deliveries, inventories, prices, backlogs, and export and import orders.
- Based on the responses, ISM calculates an index called the “diffusion index.” This index shows the percentage of businesses reporting growth or no change from the previous month.
- After obtaining the diffusion index for each factor, ISM averages them to produce a composite manufacturing index. This index reflects the overall situation of the entire manufacturing industry.
Key factors considered in calculating the ISM index:
- New orders: Indicates market demand for products.
- Production: Assesses the level of activity at factories.
- Employment: Indicates hiring or layoffs.
- Supplier deliveries: Assesses the delivery time of raw materials.
- Inventories: Measures the amount of goods a business has in stock.
- Prices: Assesses price fluctuations for raw materials.
- Other factors: Backlog of orders, export orders, import orders.
Conclusion
In conclusion, the ISM manufacturing index is an important tool for investors to better understand the manufacturing and economic situation in the United States. By monitoring this index, we can better understand the economic situation and thereby take advantage of useful information and make better trading decisions.
See now:





