












Technical analysis limits matter because charts can feel more certain than they really are. A clean trendline, moving average crossover or support zone can make the market look orderly, but technical analysis does not predict the future. It studies price behavior and helps traders organize decisions under uncertainty.
This guide is based on refreshed rendered HTML crawl data from competitor pages covering technical analysis definitions, core assumptions, chart use cases, technical vs fundamental analysis and common limitations. It is educational only and does not provide personal financial advice, guaranteed trading results, funded status, rewards or payouts.
Technical analysis limits: quick answer
The main limitation of technical analysis is that it uses historical and current price data to estimate possible market behavior. It can help identify trends, ranges, momentum and levels, but it cannot guarantee that price will continue, reverse or respect a zone.
Competitor pages commonly explain technical analysis through three assumptions: market prices reflect available information, price can move in trends, and patterns may repeat. Those assumptions can be useful, but they are not laws. Markets can absorb new information quickly, break familiar levels and behave differently when volatility changes.
| Technical analysis can help with | Technical analysis cannot guarantee |
|---|---|
| Reading trend and range conditions | That a trend will continue |
| Planning entries around levels | That price will respect the level |
| Comparing momentum with indicators | That an indicator signal will work |
| Defining invalidation points | That losses will be avoided |
| Reviewing repeatable setups | That past behavior will repeat |
Why technical analysis is still useful
Technical analysis is still useful because traders need structure. Without a framework, it is easy to chase candles, enter late, widen stops or switch bias every time price moves.
Chart analysis can answer practical questions: Is the market trending or ranging? Where has price reacted before? Is momentum expanding or fading? Where would the trade idea be invalidated?
The strongest competitor pages do not present technical analysis as magic. They frame it as a method for studying market behavior. That is the right expectation. A chart setup should help a trader build a plan, not replace the need for risk management.
Limit 1: charts show behavior, not certainty
A chart shows what market participants have done, not what they must do next. A resistance level can break. A breakout can fail. A candlestick pattern can appear and still lead to a losing trade.
This becomes dangerous when a trader turns a pattern into a prediction. For example, a double bottom may suggest a potential reversal, but it does not prove buyers will keep control. A trendline may show that buyers defended a path before, but it does not force them to defend it again.
A better question is: if this chart idea is wrong, where will the market prove it wrong? That question turns chart reading into risk planning.
Limit 2: indicators can lag price
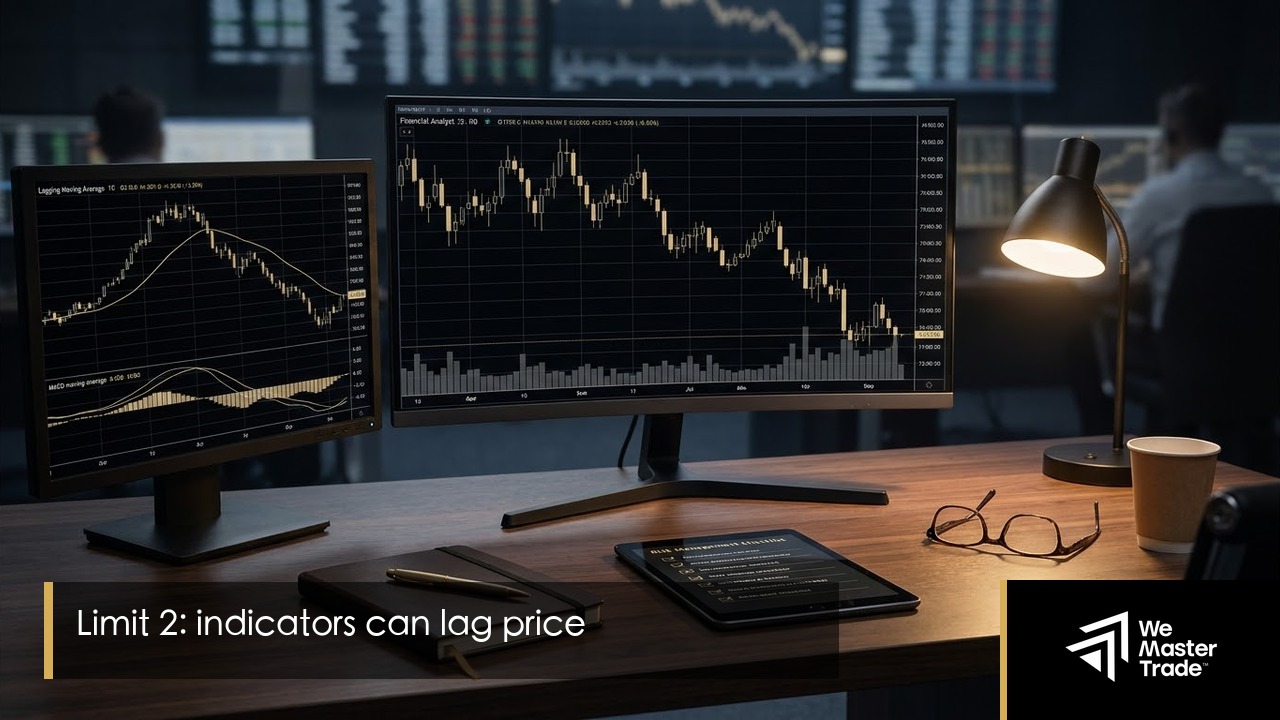
Many indicators are built from past price data. Moving averages, MACD and some momentum tools can be helpful, but they often confirm a move after it has already started.
Lag is not automatically bad. It can reduce noise and make trends easier to read. The problem starts when a trader expects a lagging indicator to lead the market.
For example, a moving average crossover can confirm that momentum has shifted, but the entry may come late. RSI can warn that a market is stretched, but a strong trend can stay stretched for longer than expected. Indicators add context; they do not remove uncertainty.
Limit 3: interpretation can be subjective
Technical analysis is not always objective. Two traders can draw different trendlines, mark different support zones or choose different indicator settings on the same chart.
Subjectivity becomes a problem when the trader adjusts the chart to defend a losing idea. Moving a trendline after entry, switching timeframe to find a better-looking level or changing indicator settings mid-trade can turn analysis into confirmation bias.
Use rules before the trade:
- Which timeframe defines the setup?
- Which level matters most?
- What confirms entry?
- What invalidates the idea?
- Where is the stop before entry?
A written rule often does more for discipline than another indicator.
Limit 4: false signals and whipsaws are normal
Rendered crawl data from limitation-focused pages repeatedly points to false signals and whipsaws. Price can break a level and quickly return. An oscillator can show divergence for several candles before price reacts. A trend can appear stable and then reverse during a volatility spike.
False signals are especially common around crowded levels, low-liquidity periods and high-impact news. If many traders watch the same breakout area, price may trigger orders and then reverse sharply.
The solution is not to avoid all technical analysis. The solution is to size positions so a false signal is survivable.
Technical analysis vs fundamental analysis
Competitor outlines often compare technical and fundamental analysis because traders need both perspectives. Technical analysis studies price behavior. Fundamental analysis studies economic, financial or macro drivers.
For forex and CFD traders, a chart can look strong before an inflation release, central bank decision or labour market report. Once the event hits, spreads and volatility can change. A level may still matter, but execution may be very different from a quiet chart example.
Technical analysis helps with timing and structure. Fundamental awareness helps the trader know when conditions may be abnormal.
How to reduce the limits of technical analysis
The safer approach is to assign each tool a job.
| Tool type | Useful question | Main limitation |
|---|---|---|
| Trendlines | Is price respecting a directional structure? | Line placement can be subjective |
| Moving averages | Is momentum broadly shifting? | Signals can lag price |
| Support and resistance | Where has price reacted before? | Levels can break or fake out |
| Oscillators | Is momentum stretched or diverging? | Strong trends can stay stretched |
| Candlestick patterns | What happened in a specific zone? | One candle rarely proves a full setup |
Then add a risk checklist:
- Define the market condition.
- Mark the invalidation level.
- Check upcoming news.
- Decide position size before entry.
- Record the setup in a journal.
- Review whether the trade followed the rules.
This turns technical analysis into a process instead of a collection of signals.
Technical analysis limits in a prop firm environment
In a prop firm environment, chart analysis is only one part of the decision. A setup may look valid but still be unsuitable if the stop is too wide, the instrument is unavailable, or the trade conflicts with drawdown limits or platform conditions.
Before applying a technical strategy, review available instruments on the Simulated Symbols page and check whether your workflow fits the Trading Platforms. You can also review Prop Trading Mistakes to avoid turning a chart idea into a rule violation.
FAQ
What are the main technical analysis limits?
The main limits include subjectivity, lagging indicators, false signals, overreliance on past price data and weak awareness of news or macro conditions.
Is technical analysis useless because it has limitations?
No. Technical analysis can still help traders organize entries, exits and invalidation points. The issue is using it as a certainty tool instead of a risk-aware decision framework.
Why do technical indicators fail?
Indicators can fail because market conditions change, price moves faster than the indicator responds, or news creates volatility that overrides a normal setup.
Should traders combine technical and fundamental analysis?
Many traders do. Technical analysis can help with levels and timing, while fundamental context can warn when economic events may change volatility.
How can beginners avoid overusing technical analysis?
Beginners can limit their tools, write entry and exit rules, avoid changing settings mid-trade and review trades in a journal.
Use charts as one part of the trading process
Technical analysis works best when it helps you ask better questions: where is the trend, where is invalidation, what could change the setup and is the risk acceptable?
For traders comparing prop firm routes, that same mindset should apply before selecting a Trading Challenge or Instant Evaluation. Review the rules first, then decide whether your chart-based process fits the environment.





