












In the often changing realm of financial markets, inefficiencies may provide traders great opportunities. One kind of method for profit on inefficiencies is mean reversion trading strategies. This approach is predicated on the idea that over time asset values often revert to their average or historical levels. Traders may use market imbalances to find effective points of entrance and departure. In this article, we will discuss how to use mean reversion techniques, assess actual events, and provide recommendations for improving the approach to maximize returns while controlling risk.
Understanding Mean Reversion Trading Strategies
The theory of mean reversion trading strategies is that asset prices will eventually return to their long-term average after enough deviations from their standard. Basically, it is expected for a stock or other financial instrument to revert to the mean if it deviates too far from its historical average. A number of factors might lead to this deviation from the usual, including market sentiment, overbought or oversold levels, or economic events.
Mean reversion strategies allow traders and investors to essentially gamble that market inefficiencies will self-correct and bring prices back into equilibrium.
Key concepts:
- Historical Average: The long-term average price of an item, often calculated using moving averages (e.g., 50-day and 200-day moving averages). This serves as a reference point for determining if an asset is underperforming or outperforming its normal price range.
- Overbought/Oversold: A circumstance in which the price of an asset has increased or decreased significantly in a short time. When an asset becomes overbought or oversold, it often indicates a price reversal or correction.
- Reversion to the Mean: The belief that prices will revert to their mean after a period of severe divergence. This notion believes that price extremes are unsustainable and that the market will ultimately return to more normal circumstances.
Popular Mean Reversion Trading Strategies
Traders employ a variety of tactics and tools to implement mean reversion successfully. These techniques often seek to find assets that have outperformed or underperformed their historical averages. The following are some of the most often utilized reversion trading strategies:
Moving Averages
A moving average smooths out price data over a specific period to provide a trend-following indicator that could help traders determine whether a company is overbought or oversold. Several moving averages may be used depending on the trader’s strategy and time horizon: the 200-day moving average for long-term trends and the 10-day, 20-day, or 50-day moving averages for short-term trends.
- Short-Term Mean Reversion: A stock price may be overbought and will probably revert down in the near run if it rises far above its 20-day or 50-day moving average.
- Long-Term Mean Reversion: In the same vein, should the price fall below its 200-day moving average, it might indicate an oversold condition, therefore suggesting a future price increase.
Bollinger Bands
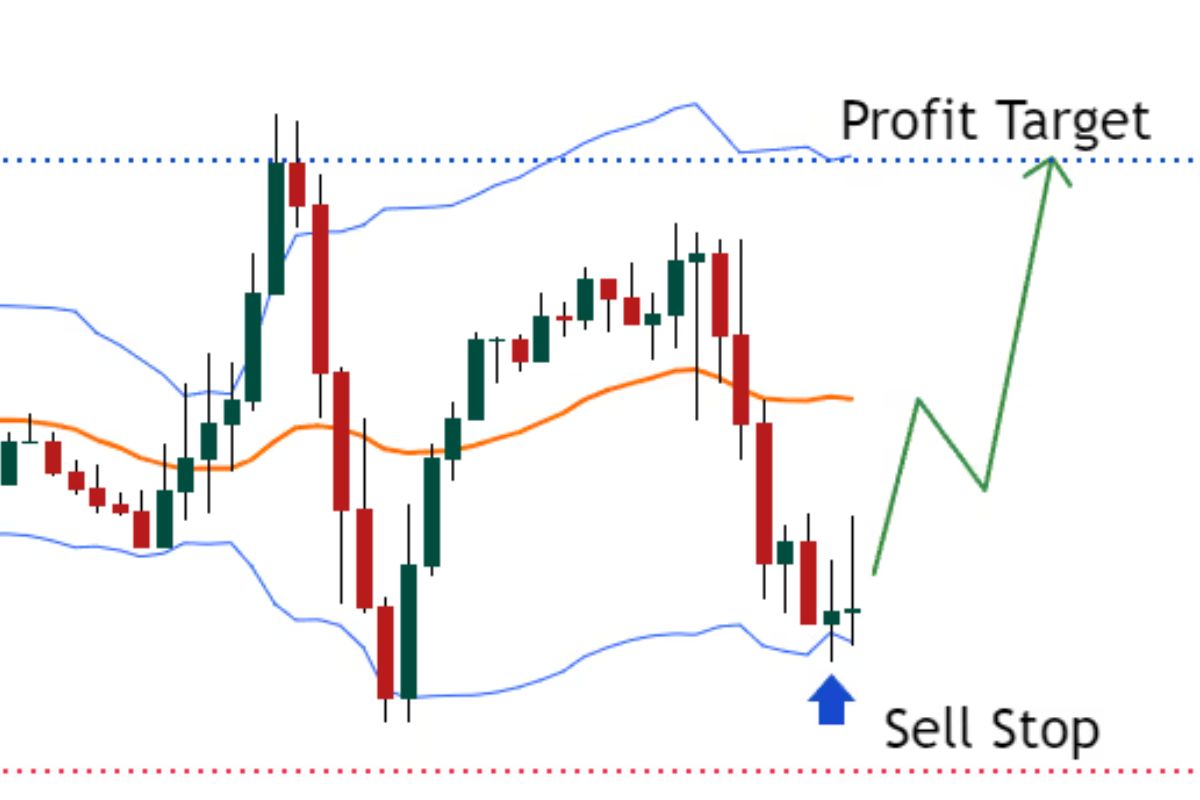
A versatile trading method, Bollinger Bands evaluate the volatility of an asset and price departure from the mean. Made of a center band—a moving average—and upper and lower bands separated a certain number of standard deviations from the main band, Bollinger Bands.
Sometimes, an asset’s price movements outside of the Bollinger Bands indicate that the asset is overbought or oversold, thereby offering a mean reversion potential. A price shift inside the bands might point to a mean return.
- Overbought position: Should the price of a stock stray from the higher Bollinger Band, it might be in an overbited state. Expecting the price to revert to the middle band—the mean—a trader would sell or short the stock.
- Oversold position: Should the price go beyond the lower Bollinger Band, this might point to an oversold position—that of a probable bounce back to the middle band.
Relative Strength Index (RSI)
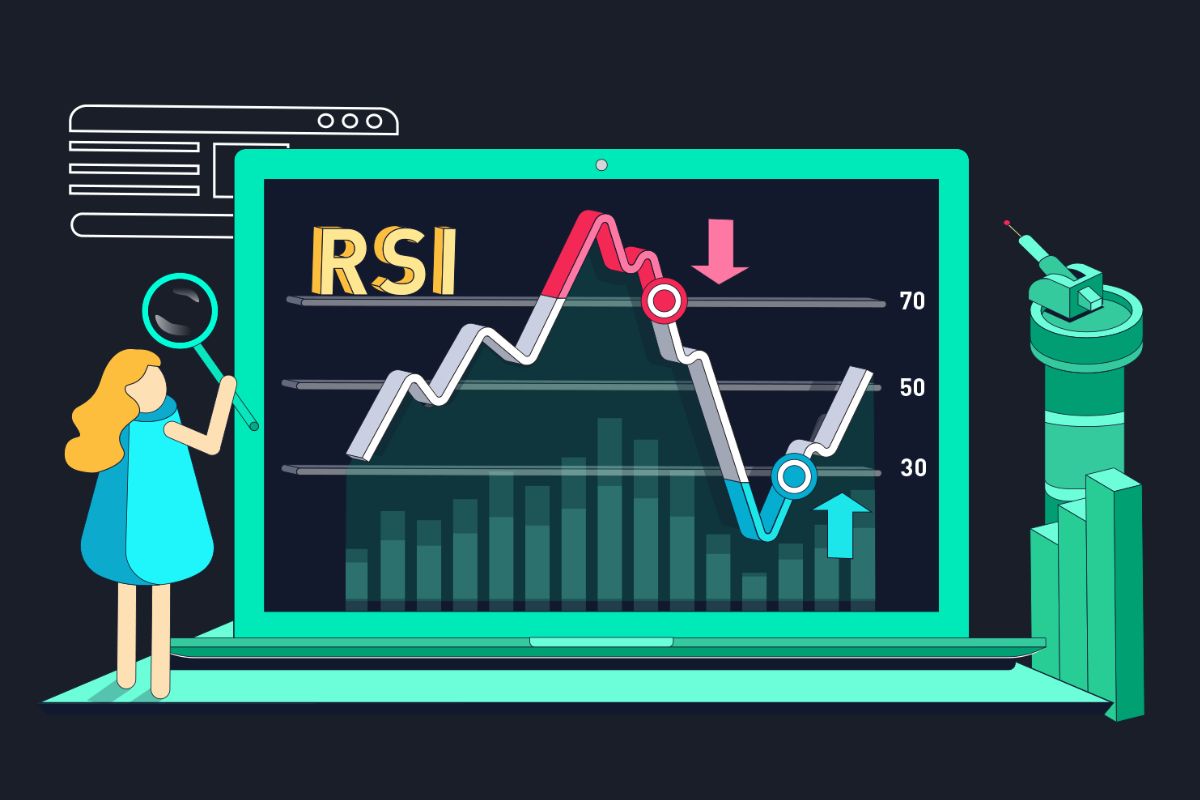
One well-known momentum indicator that picks overbought and oversold situations is the Relative Strength Index (RSI). RSI readings higher than 70 point to an asset overbought; values less than 30 point to an oversold asset.
For example:
- Overbought position: If a stock’s RSI exceeds 70, it may indicate that the asset is overbought and ready for a price correction or return to the mean.
- Oversold position: If the RSI is less than 30, it indicates that the asset has been oversold, which might result in a recovery back to the mean.
Risks and Challenges of Mean Reversion Trading Strategies
Despite the potential for profit, mean reversion trading strategies has a number of dangers and hurdles that traders must consider. Understanding these risks is critical for creating a strong trading strategy and avoiding expensive blunders. We will go over these difficulties in depth and provide examples below.
Trend Reversal Failures
The inability of prices to return to the mean is one of the most difficult aspects of mean reversion investing. Though it may not always happen, mean reversion suggests that prices will finally revert to their historical norm. In certain circumstances, significant market moves or fundamental changes may result in a long deviation, making the mean less noteworthy.
For example:
A brief setback, like lower-than-expected sales, might cause a company’s stock to drop below its 200-day moving average. Buying the stock with an eye toward recovery, a mean reversion trader may On the other hand, should the firm disclose a significant structural problem—such as a bankruptcy risk or a loss of market share—the stock price can keep declining until it falls to the mean.
False Signal
Mean reversion techniques may use indicators such RSI, Bollinger Bands, and moving averages, although they might provide false signals. These signals may mislead traders in unstable or changing markets by indicating overbought or oversold conditions, therefore encouraging unprofitable trades.
For example:
In a highly surging market, a stock may trade continuously over its upper Bollinger band. A trader using Bollinger Bands would perceive this as an overbought indication and short the stock, anticipating a turnaround. However, if the stock is in a bull market, fueled by favorable news or investor emotion, the price may continue to increase, causing losses.
Depend on Market Conditions

Extreme market situations, such as financial crises, big geopolitical events, or abrupt economic transformations, might make mean reversion tactics useless. In these cases, prices often diverge widely from historical norms and may take much longer—or fail entirely—to return.
For example:
Many equities fell dramatically and remained far below their historical norms for months or even years during the 2008 financial crisis. A trader using a mean reversion strategy may have bought these stocks expecting a quick recovery only to incur large losses as the market kept down.
Likewise, during the COVID-19 epidemic in 2020, unanticipated market shocks generated extraordinary volatility and mean reversion techniques were often disrupted by consistent deviations from previous standards.
Managing Risks And Optimize Mean Reversion Trading Strategies
To succeed in mean reversion trading strategies, you must account for these risks and adopt a disciplined strategy. Below are some excellent practices:
Diversification
Avoid focusing too much funds on a single deal, since this raises the risk of unanticipated losses. Spreading investments across several assets or sectors allows you to mitigate risks and decrease reliance on a single position. Diversification serves as a safety net, particularly in unpredictable markets when some transactions might fail suddenly.
Stop Loss Orders
Stop-loss orders are an important tool for limiting possible losses when the market goes against your position. These automatic solutions guarantee that you abandon transactions before the consequences become too severe, especially in extremely volatile markets. Proper stop-loss placement also helps to conserve cash, allowing you to remain in the game for future possibilities.
Confirmation of Multiple Indicators
Relying on a single indication might result in misleading signals, thus it’s critical to employ many techniques for confirmation. For example, integrating Bollinger Bands with RSI or moving averages gives a more thorough understanding of overbought or oversold positions. This tiered technique improves the accuracy of your trades while decreasing the risk of responding on false signals.
Risk/Reward Ratio
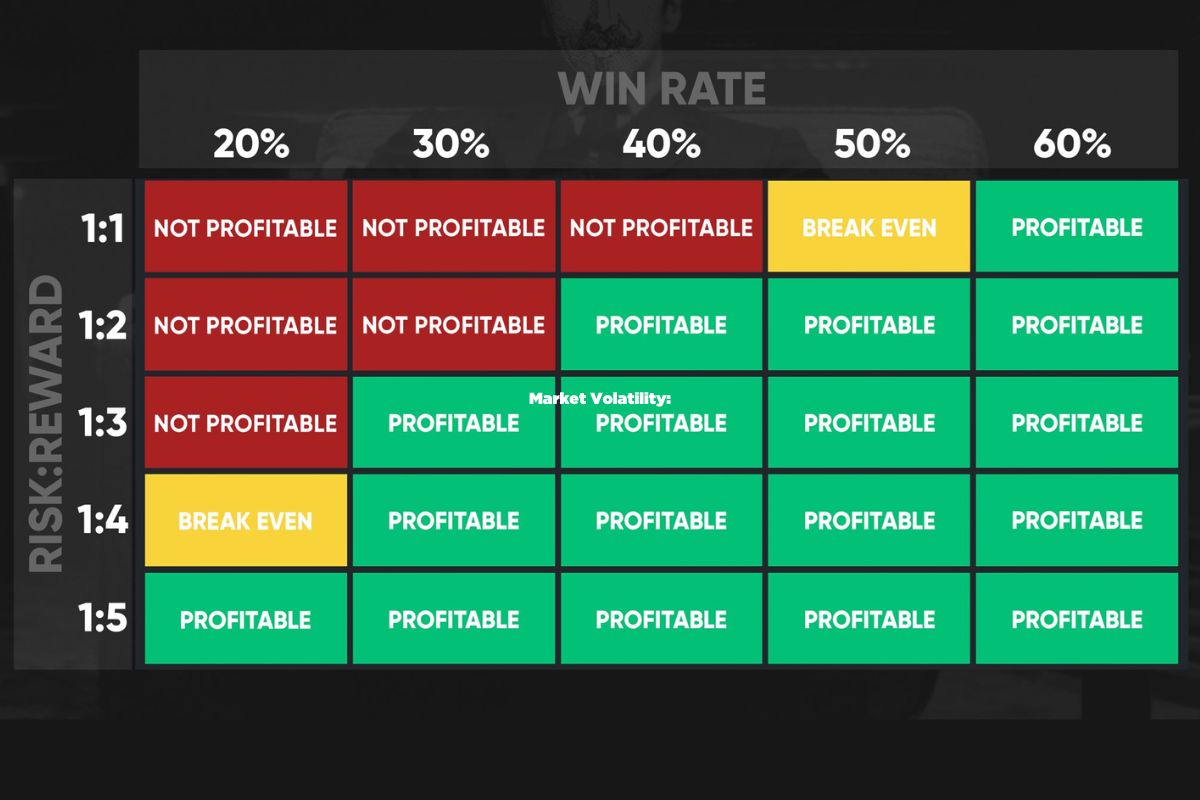
Always weigh the possible benefit versus the risk before joining a deal. A frequent objective is to strive for a risk-reward ratio of at least 2:1, which ensures that a few successful transactions can offset several losses. Maintaining this discipline improves long-term profitability while reducing emotional decision-making amid difficult market situations.
Timeframe Selection
Choosing the right period is critical for matching with your trading objectives and approach. Shorter periods, such as 10-minute or hourly charts, are good for intraday traders who seek frequent chances. Longer periods, such as daily or weekly charts, are better suited to traders looking for bigger returns, but they demand more patience and cash reserves.
Understand Macroeconomic Trends
Macroeconomic variables like interest rate fluctuations and geopolitical developments may have a big influence on asset values. Understanding these tendencies allows you to forecast situations in which mean reversion may fail, such as times of strong market momentum. Staying updated about economic market trends allows you to alter strategy and prevent expensive shocks.
Consistent Backtesting
Backtesting enables traders to assess the success of their strategies based on past data. By testing under different market situations, you may uncover possible flaws and fine-tune parameters like as moving averages or RSI levels. Regular backtesting guarantees that your approach is still relevant and adaptive to shifting market conditions.
Regular Price Monitoring
Mean reversion chances need close monitoring of market fluctuations in order to respond quickly when circumstances are favorable. Using alerts or real-time graphing tools may help you identify deviations from the mean before they vanish. Consistent monitoring also enables for timely modifications to your trading strategy, which increases your chances of success.
Try more trading strategies with lowest risk by WeCopyTrade services!
Conclusion
Mean reversion trading strategies is more than simply a technical strategy; it combines strategic thought, focused execution, and ongoing learning. Patience, flexibility, and an awareness of market dynamics are all required for success with this method. Traders may get consistent market opportunities by concentrating on measured risks and developing approaches via experience and research. Finally, mean reversion trading is about preparing oneself to react intelligently to market cues rather than forecasting the future.
For more helpful trading informations, check out: https://wemastertrade.com/





