












The structural dynamics of international currency markets demand extreme precision from systematic participants. Retail and institutional spot forex volume exceeds several trillion dollars daily, yet a significant majority of individual trading accounts experience net losses within their first year of live execution due to unverified execution logic. To survive this landscape, a trader must transition from intuitive speculation to algorithmic and statistical validation.
This comprehensive technical guide breaks down the core architectures of quantitative currency testing, illuminating how to build, refine, and stress-test systematic models. By analyzing structural data parameters, trade mechanics, and defensive validation metrics, readers will acquire the precise operational knowledge required to transform historical data into forward-market profitability.
1. What Is Forex Backtesting and How Does It Work?
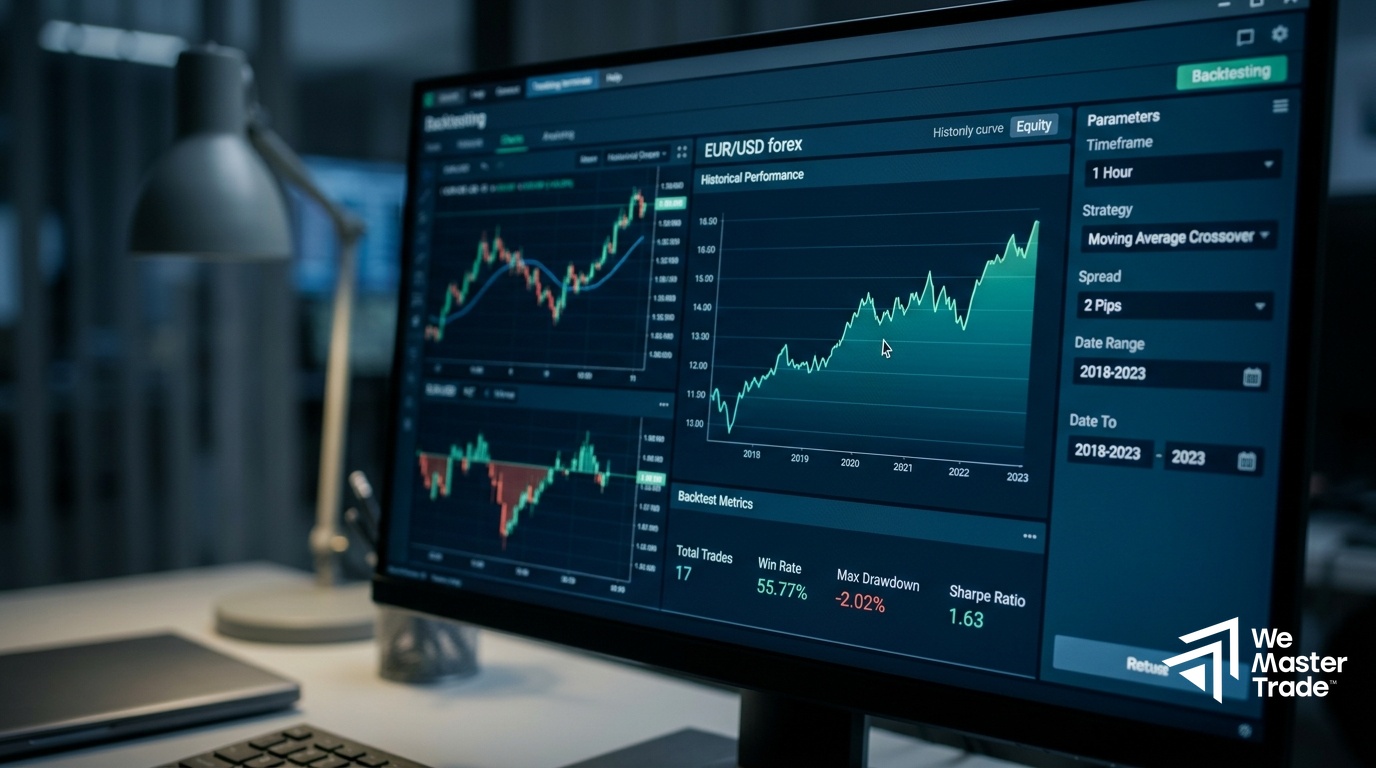
Forex backtesting serves as the baseline diagnostic filter for any systematic trading framework. The underlying process involves executing a precise, rule-based algorithmic model or structural price action methodology against comprehensive historical market data. By recreating the exact sequence of past market bars, the simulation provides an objective window into how a specific edge would have absorbed real-world drawdowns, trend shifts, and structural market regimes without risking operational capital.
This quantitative process strips emotional bias from the trading equation entirely. Instead of relying on a human memory that naturally over-emphasizes winning streaks, a systematic test calculates hard mathematical outcomes. It acts as an engineering stress test, proving whether a strategy’s underlying edge possesses true mathematical expectancy or if its recent successes were merely a byproduct of random market distributions.
Establishing an enterprise-level historical simulation requires access to complete, unmanipulated liquidity records across various currency pairs. Platforms like WeMasterTrade emphasize that statistical verification is the single most defining characteristic that separates institutional-grade operators from retail gamblers. Without historical confirmation, a participant is merely guessing in an environment heavily dominated by automated high-frequency liquidity providers.
2. Manual vs. Automated Forex Backtesting Methodologies
Traders generally evaluate trading ideas via two main avenues: manual simulation or automated programmatic execution. Manual testing requires a operator to systematically scroll back through past price charts bar by bar, identifying technical indicators or candlestick patterns, and manually logging every execution entry, exit, stop-loss, and take-profit inside a backtesting excel template. While highly effective for reading nuanced price action setups, it is labor-intensive and highly susceptible to subconscious look-ahead bias, where a trader accidentally modifies execution choices because they can already see the subsequent expansion bars.
Conversely, deploying an automated trading strategy utilizes specialized forex backtesting software to execute predefined code lines instantly across decades of data. This methodology eliminates execution bias and unlocks massive quantitative capabilities, such as running a complex Monte Carlo simulation forex calculation to model thousands of randomized equity curve sequences.
| Methodology | Primary Advantages | Critical Constraints | Ideal Use Case |
| Manual Simulation | Develops deep context for discretionary price action; requires zero programming knowledge. | High operational fatigue; limited sample size; exposed to look-ahead distortion. | Intraday structural patterns and discretionary swing models. |
| Automated Execution | Processes large historical data samples in seconds; completely removes execution bias. | Demands software proficiency; susceptible to extreme curve fitting forex errors. | Algorithmic trading models and multi-pair portfolio systems. |
Traders who successfully isolate a verifiable automated edge often seek out capital deployment structures that reward their systematic consistency immediately. Utilizing professional instant funded accounts enables automated operators to bypass traditional institutional roadblocks, allowing them to scale their tested models rapidly inside institutional liquidity pools once their historical drawdowns are clearly bounded.

3. How to Source and Verify High-Quality Historical Market Data
The structural integrity of any simulation depends entirely on the precision of its underlying data inputs. Default platform setups, such as the standard MetaTrader strategy tester engine utilizing basic historical archives, routinely yield modeling quality outcomes below fifty percent. This distortion occurs because the platform uses fractal interpolation to simulate lower-timeframe moves from basic one-minute bars, effectively fabricating false intra-candle price movements that never occurred in the live market.
To run authoritative testing, algorithmic trading models must utilize tick data 99% quality profiles sourced from institutional interbank feeds. A single year of raw, tick-by-tick market data for a major pair like EURUSD requires roughly two and a half gigabytes of digital storage, whereas interpolated one-minute data takes up less than twenty-five megabytes.
Achieving institutional precision requires integrating premium tools like Tick Data Suite to feed actual, unfiltered historical matching parameters directly into your strategy tester. This architecture accurately records every micro-structural tick fluctuation, ensuring that tight breakout triggers, trailing stops, and complex execution logic behave exactly as they would when interacting with live broker matching queues.
4. Step-by-Step: Setting Up a Realistic Strategy Tester Environment
Replicating true live market conditions requires configuring execution parameters to account for the frictional transaction costs that erode profitability in real-world environments. Failing to implement these constraints transforms an otherwise viable historical strategy into a bankrupt live system.
Adjusting Spreads, Commissions, and Slippage
Most free testing environments assume a flat, unchanging spread and perfect, zero-latency execution fills. In reality, interbank liquidity pools experience violent spread expansions during tier-one macroeconomic data releases and regional session transitions. Your software environment must be configured to model variable, historical spreads rather than static parameters. Furthermore, you must explicitly input fixed per-lot round-turn commissions and add realistic slippage parameters (such as a two-tick negative execution offset) to mimic the realities of electronic order queueing.
Accounting for Regional Timezones and Overnight Swaps
Foreign exchange positions held past the regional New York close incur overnight swap fees or credits based on central bank interest rate differentials. If your backtest spans multiple years, omitting these swap rates can artificially inflate your strategy’s apparent performance, particularly for swing trading frameworks that maintain open positions for several days or weeks. Ensure your historical data feed includes accurate interest rate data and maps perfectly to your broker’s specific server timezone to avoid misalignment around weekly candle openings.
5. Critical Performance Metrics: Beyond Just the Win Rate
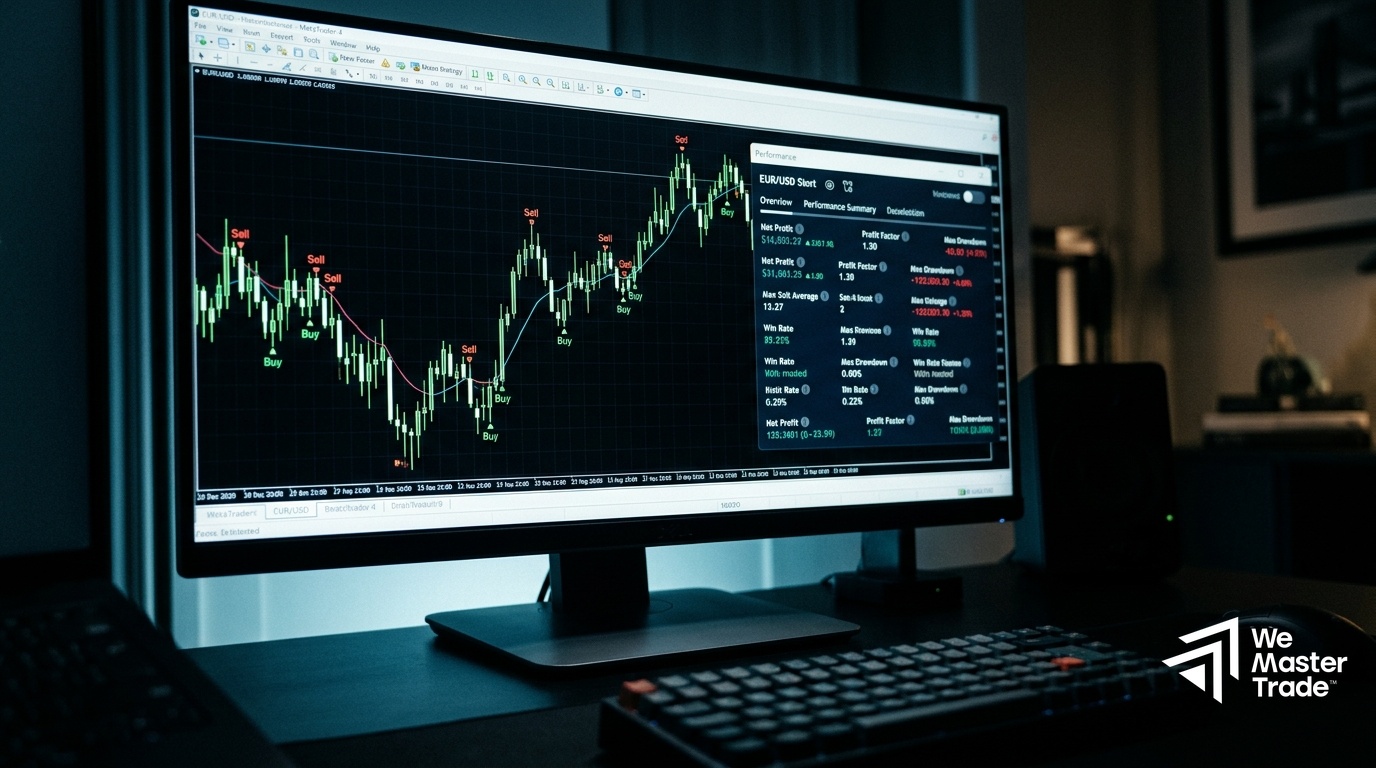
Amateur market participants judge the viability of a strategy almost exclusively by its historical win rate. Experienced quantitative analysts recognize that surface-level win percentages are mathematically irrelevant without deep contextual reference to specific risk management metrics. A strategy winning eighty percent of its sequences will rapidly bankrupt an account if its average loss is ten times larger than its average win.
To truly validate an edge, engineers evaluate several core multi-dimensional performance ratios:
- Profit Factor: Calculated as gross financial profits divided by gross financial losses over the entire sample size. A sustainable system typically prints a profit factor ranging between 1.25 and 1.75; anything exceeding 2.0 frequently signals a highly dangerous over-optimized model.
- Maximum Drawdown: Represents the largest recorded peak-to-trough capital decline on the equity curve. This structural metric dictates the capital preservation boundaries and capitalization requirements of the strategy.
- Recovery Factor: Calculated as net absolute profit divided by maximum drawdown. This ratio illuminates exactly how efficiently a strategy repairs its equity curve after experiencing an extended series of losses.
- Mathematical Expectancy: The average financial outcome of each trade executed, written as the average win multiplied by the win probability, minus the average loss multiplied by the loss probability.
6. Pitfalls of Overfitting and How to Use Out-of-Sample Testing
The most pervasive error in algorithmic strategy development is curve-fitting. This issue arises when an operator optimizes a set of technical indicator variables so exhaustively that the strategy perfectly matches the specific noise of a single historical data segment. While this practice produces near-flawless backtesting reports, the system almost instantly fails when introduced to fresh live market data because it has memorized past price movements rather than isolating an enduring structural edge.
To insulate your capital against these dynamics, you must master strict out of sample testing protocols. Before running any optimization routines, segment your total historical data archive into two distinct blocks:
- In-Sample Dataset (70% of total history): Use this data block exclusively to build your rules, optimize indicator periods, and refine entry thresholds.
- Out-of-Sample Dataset (30% of total history): Keep this data block entirely isolated during development. Once your strategy is finalized, run it across this unseen data without changing a single setting.
If the performance metrics on your out-of-sample data remain stable and mimic the in-sample results, your strategy possesses structural robustness. If the performance degrades severely, your model is over-optimized and must be discarded. Reviewing a structured list of backtesting pitfalls to avoid helps engineers identify these logical validation errors long before deploying capital into unpredictable forward market regimes.
7. Key Questions About Forex Backtesting Answered
What is forex backtesting and why is it important?
Forex backtesting is the operational practice of running a defined set of trading rules through historical price data to calculate how that specific strategy would have performed in the past. It is critically important because it provides an empirical, objective evaluation of a strategy’s safety parameters, risk profiles, and mathematical expectancy before a trader exposes live capital to market risks.
What is the difference between in-sample and out-of-sample data?
In-sample data represents the core historical data segment utilized by a developer to discover, build, and optimize a strategy’s parameters. Out-of-sample data is a separate, completely clean block of market history that the strategy has never analyzed during its development phase, serving as an uncompromised validation test to confirm the system’s ability to navigate future market variations.
How does curve-fitting ruin a backtest?
Curve-fitting occurs when a trading model’s rules are tweaked too precisely to conform to the historical idiosyncrasies of a specific data group. This design flaw creates an elite historical report but destroys live market utility, as the model cannot adapt to new, unseen price distributions and structural market changes.
Why do backtest results differ from live trading performance?
Discrepancies appear because standard backtests often ignore variable execution variables, real-world slippage, broker execution latency, and spread widening during low-liquidity sessions. Furthermore, backtesting entirely eliminates the psychological and emotional barriers that frequently cause human operators to abandon their rules during real-world drawdowns.

The WeMasterTrade Advantage: Scaling Validated Strategies
Once a trader masters the technical mechanics of forex backtesting and verifies a strategy with stable out-of-sample performance metrics, they inevitably face the steep challenge of undercapitalization. Operating a highly refined system with institutional risk management metrics yields negligible real-world returns if the underlying account balance is limited to a few thousand dollars. This capital bottleneck often tempts systematic traders to over-leverage their positions, effectively destroying the careful risk boundaries established during their historical simulations.
WeMasterTrade directly solves this scaling issue by eliminating the traditional roadblocks associated with institutional funding access. Founded in Canada in 2021, the organization operates an innovative Angel Funding business model that bypasses the lengthy, stressful multi-phase evaluation processes popularized by traditional prop firms. Instead of forcing systematic traders to spend months chasing arbitrary profit targets inside simulated environments, this ecosystem provides immediate access to funded trading accounts.
The structural foundation of this model relies on an advanced, proprietary risk-sharing mechanism. WeMasterTrade maintains a dedicated, highly specialized Risk Management team that continually monitors real-time execution feeds across funded accounts. When an experienced trader executes a position that aligns with their validated, high-probability historical parameters, the risk desk duplicates that trade at up to a one-to-four copy ratio alongside the trader’s position within the firm’s central corporate accounts.
This deep operational alignment ensures that the firm’s core profitability remains entirely dependent on the long-term consistency of its trading partners. Successful operators receive an institutional profit split reaching up to ninety percent in their favor. For systematic traders who have utilized rigorous data to eliminate emotional bias and isolate a verifiable market edge, WeMasterTrade provides the necessary capital scale and professional partnership structure required to maximize execution efficiency without evaluation delays.





