













Position Trading is a powerful long-term investment strategy designed for traders who want to profit from major market trends. Unlike short-term trading, it involves holding assets for weeks, months, or even years to capture significant market movements. This strategy requires patience, market analysis, and a solid understanding of trends, making it ideal for those looking to minimize daily fluctuations and focus on the bigger picture. Ready to master Position Trading and make smarter investments? Explore our guide and start building your trading strategy today!
What is Position Trading?

Position trading is a long-term investment strategy where traders hold financial assets like stocks, commodities, or currencies for an extended period, ranging from several weeks to several years, aiming to capitalize on major price trends. Instead of tracking short-term fluctuations, traders focus on long-term trends and the overall market picture. Fundamental analysis is often used to assess the long-term value of assets, while technical analysis helps determine suitable entry and exit points.
Compared to other strategies like day trading or swing trading, position trading involves fewer trades, reducing stress and transaction costs. However, this strategy requires patience, as investments are tied up for longer periods and must withstand short-term market fluctuations. It is an ideal choice for investors seeking substantial long-term gains.
See more:
- 4 Methods to Use Swing Trading Effectively in Forex 2024
- What is Day Trading? How to use Day Trading effectively
- Top 6 Simple Scalping Trading Strategies When Doing It
How does position trading determine trends?
Position trading determines trends primarily through a combination of technical analysis and fundamental analysis. Here’s a breakdown of the methods commonly used to identify and confirm trends:
Technical Analysis
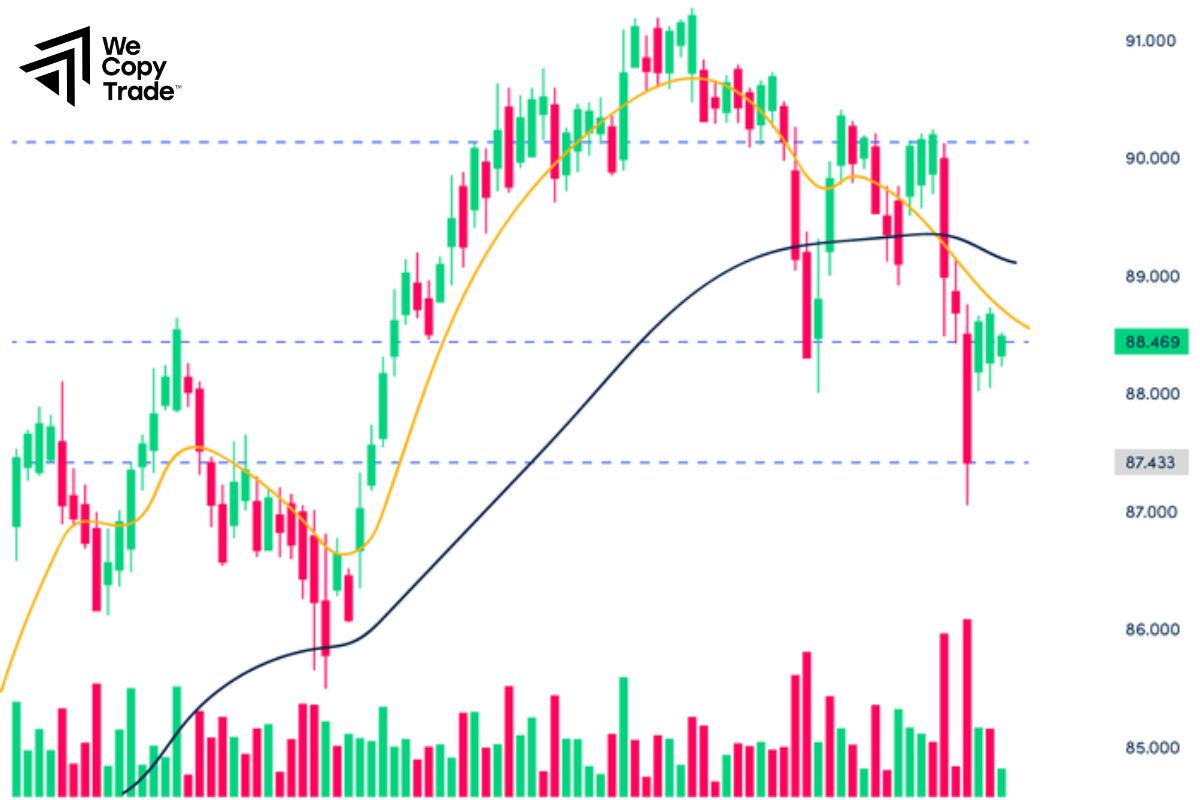
- Moving Averages: Position traders often use indicators like the 200-day moving average or 50-day moving average to identify long-term trends. When the price of an asset is above a long-term moving average, it indicates an upward trend, while a price below suggests a downward trend.
- Trendlines: Drawing trendlines on price charts helps to visually confirm whether the market is moving upwards, downwards, or sideways. A series of higher highs and higher lows indicates an uptrend, while lower highs and lower lows point to a downtrend.
- Support and Resistance Levels: Identifying areas where prices have historically reversed can help traders understand whether a trend is likely to continue or reverse. If a price breaks through a strong resistance level, it might indicate the start of a new uptrend.
- Technical Indicators: Indicators like the Relative Strength Index or MACD are used to gauge market momentum and identify whether an asset is overbought or oversold, signaling potential trend changes.
- Chart Patterns: Recognizing patterns like head and shoulders, double tops/bottoms, or flags and pennants can give clues about the direction and strength of a trend.
Fundamental Analysis
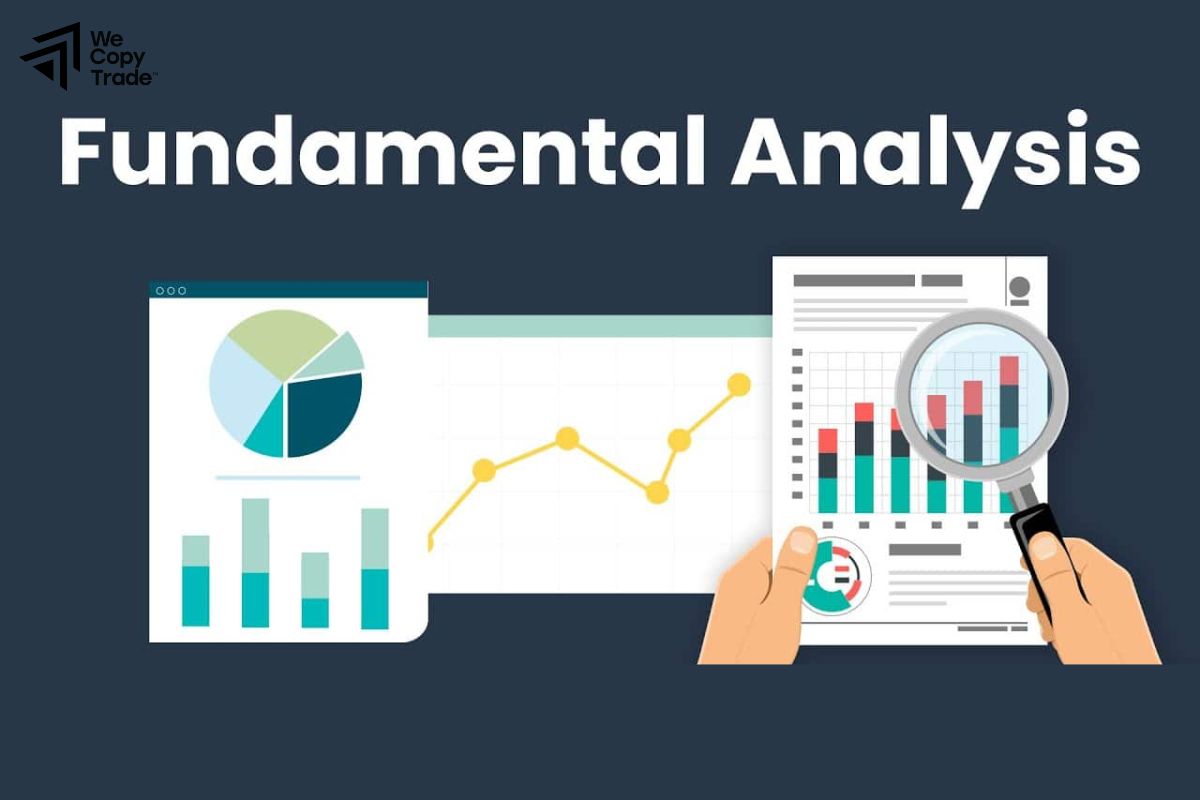
- Economic Indicators: Position traders look at key economic data such as GDP growth, unemployment rates, inflation, and interest rates to predict long-term market trends. Positive economic indicators can suggest a bullish trend, while negative data can indicate a bearish trend.
- Industry Trends: Changes within a particular sector or industry can signal potential long-term movements. For instance, advancements in technology or shifts in consumer behavior can drive sector-specific trends.
- Company Performance: For stocks, analyzing a company’s fundamentals like earnings reports, revenue growth, and future projections can help determine if a stock is likely to trend up or down.
- Global Events: Geopolitical developments, global market trends, and significant world events (like political shifts, wars, or pandemics) can influence long-term trends in various asset classes.
4 Position Trading Strategies in Cryptocurrency
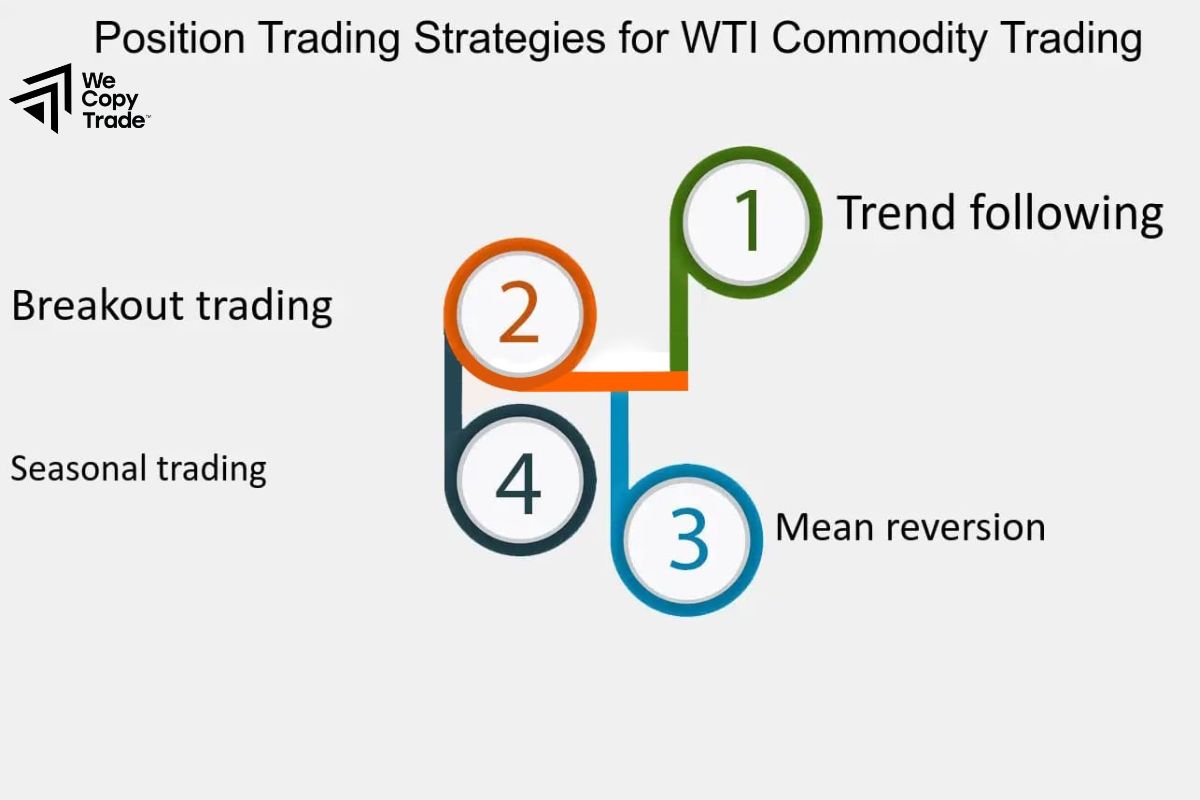
Here are four common position trading strategies used in cryptocurrency:
Buy and Hold Strategy
This is one of the simplest position trading strategies where traders buy a cryptocurrency and hold it for an extended period, often months or even years.
- The aim is to benefit from long-term price appreciation by riding the broader trend.
- Traders rely on fundamental analysis, looking at factors like the project’s technology, use case, market adoption, and development team. Patience is essential, as short-term volatility is ignored.
Trend Following
This strategy involves identifying a clear long-term trend and entering a position to follow it. Traders use technical indicators like moving averages, trendlines, and momentum indicators to confirm the trend’s direction.
- The goal is to enter the market when a trend starts and hold the position as long as the trend continues. Traders may exit the position when signs of trend reversal appear.
- Technical analysis plays a crucial role. Indicators like the 200-day moving average help confirm uptrends or downtrends. Stop-loss orders can be used to protect against unexpected trend reversals.
Breakout Strategy
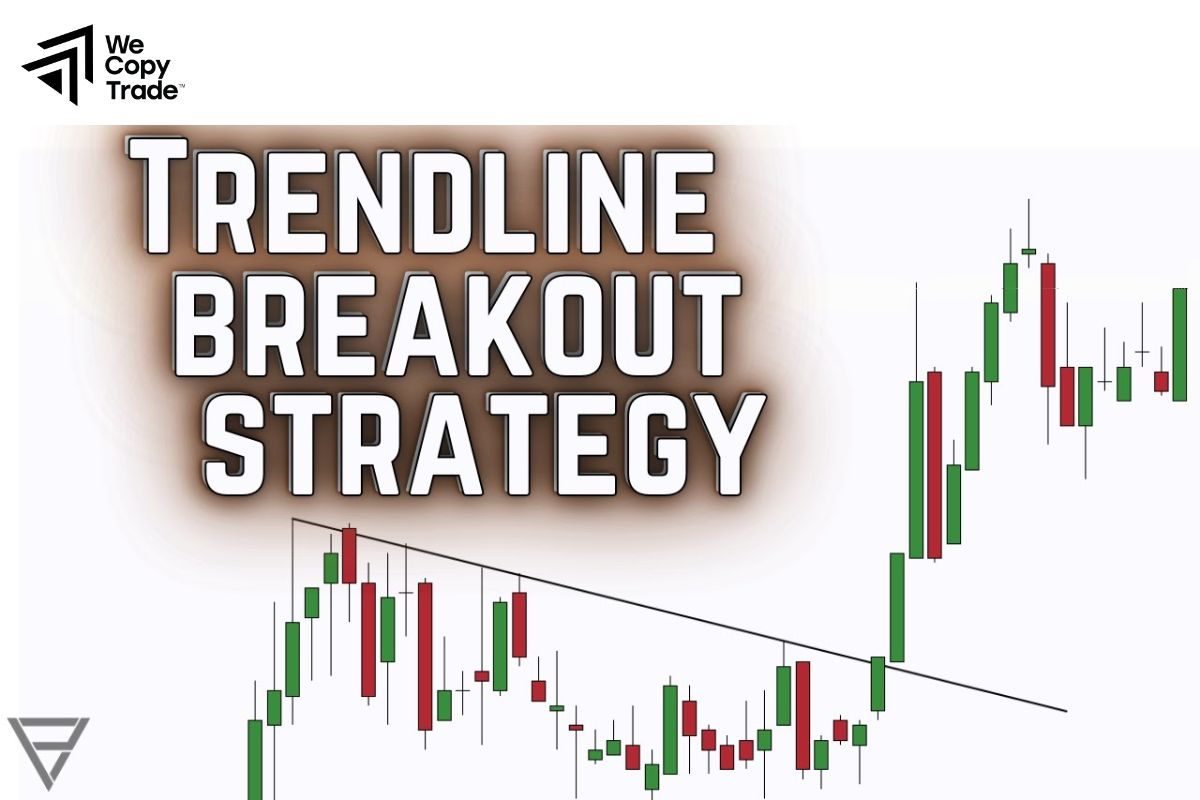
A breakout strategy focuses on identifying key support and resistance levels and trading when the price breaks out of these zones. A breakout above resistance indicates a potential upward trend, while a breakout below support suggests a downtrend.
- To capitalize on strong price movements following a breakout, which often signals the beginning of a new trend.
- Traders often use chart patterns like triangles, flags, and pennants to identify potential breakout points. Volume analysis is also important, as high trading volume during a breakout can validate its strength.
Contrarian Strategy
This strategy involves taking positions contrary to the prevailing market sentiment. Contrarian traders buy when the market is in a period of fear and sell when there is excessive hype or euphoria.
- To take advantage of market overreactions and corrections, aiming to buy low and sell high.
- This strategy requires a good understanding of market sentiment and fundamental analysis. Indicators like the RSI can help identify oversold or overbought conditions, signaling potential entry or exit points.
Guide to Trading with Position Trading Strategy
If you are new to Position Trading strategies, please refer to and apply the 4 basic steps below:
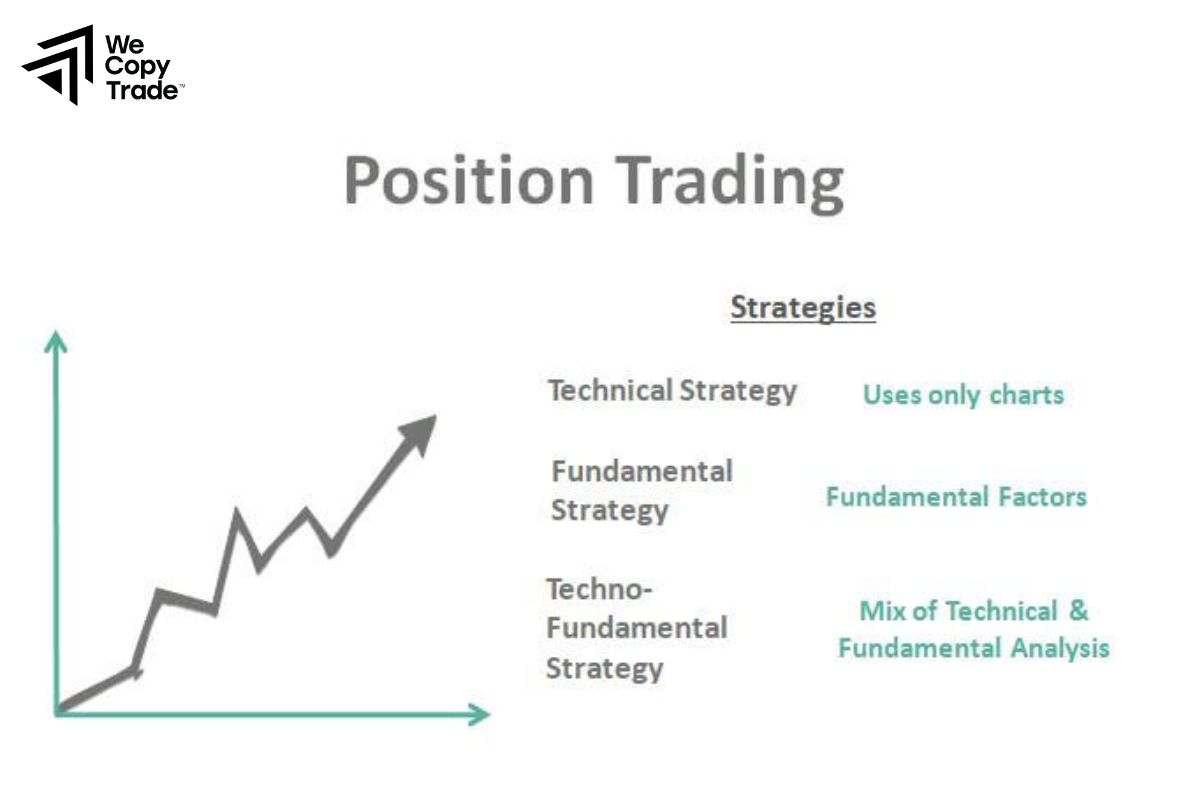
- First, use the price chart to easily identify the main trend of that market.
- Continue to choose the cryptocurrency that matches the trend you identified in the above step.
- Then, decide on the buying and selling prices for the selected asset.
- Finally, set a stop-loss to protect capital and take profit when reaching the price target.
5 Techniques to Help Traders Enter Orders Easily with Position Trading
Here are 5 techniques that can help traders enter orders easily with Position Trading:
Moving Averages for Entry Signals
- Moving averages (e.g., 50-day or 200-day) are popular tools to determine the market’s long-term direction. Enter a position when the price crosses above or below a significant moving average, signaling a potential trend shift.
- A Golden Cross can signal a buying opportunity, while a Death Cross can indicate a selling opportunity.
Trendline Breaks
- Drawing trendlines on charts helps identify breakout points. Enter a trade when the price breaks above a resistance line in an uptrend or below a support line in a downtrend, signaling that the trend is likely to continue.
- When the price breaks through key levels, it often signifies the start of a new trend, making it an ideal entry point for position traders.
Chart Patterns
- Use chart patterns like head and shoulders, double tops/bottoms, triangles, and flags to spot potential entry points. These patterns help indicate future price direction, allowing traders to enter the market at the right time.
- Look for volume spikes during pattern breaks, as this can confirm the strength of the trend and validate the entry signal.
RSI for Overbought/Oversold Conditions
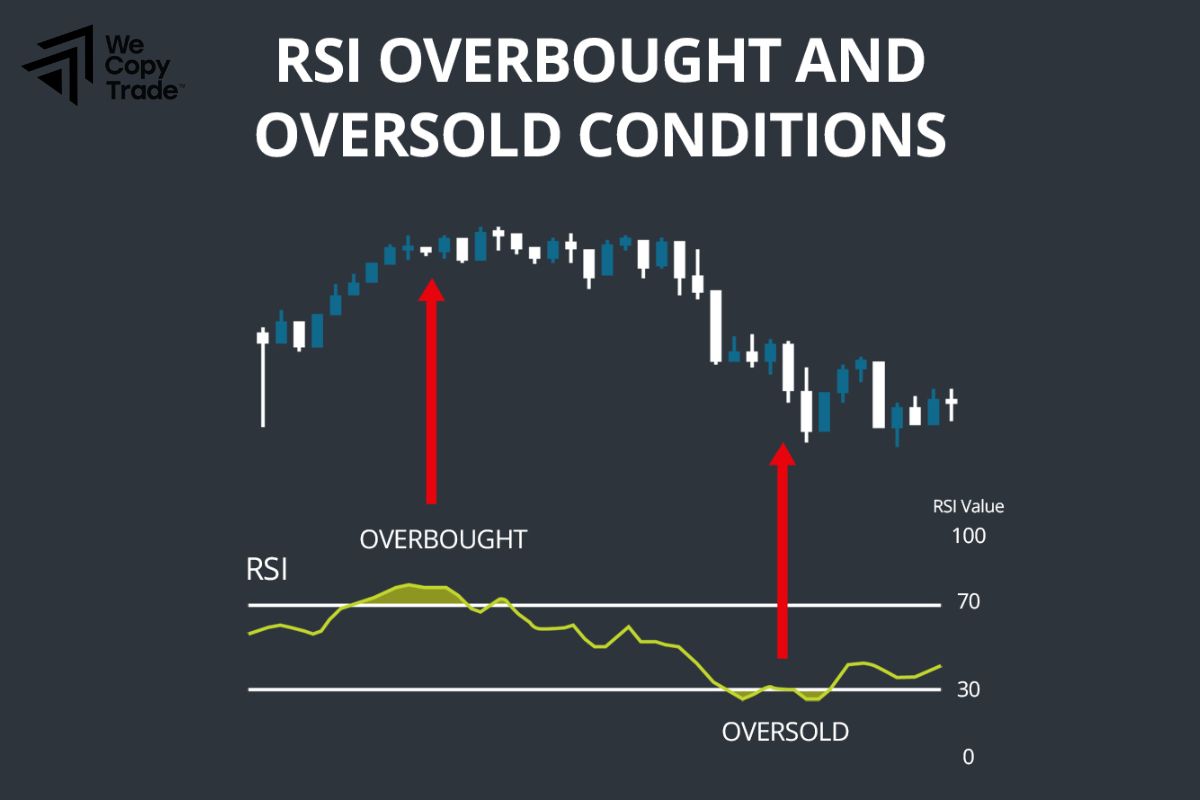
- The RSI is an excellent tool to gauge market momentum.
- An RSI below 30 can indicate that an asset is oversold (buy signal), while an RSI above 70 suggests overbought conditions (sell signal). Position traders use these signals to time entries at the right points in the trend.
Fundamental Analysis to Align with Market Sentiment
- Position trading is often based on long-term trends, and understanding the fundamental factors driving an asset’s value is key.
- Major economic events or news can create momentum. Entering a position after an event that supports a trend can improve the chances of a successful trade.
What is the Difference Between a Passive Investor and a Position Trader?
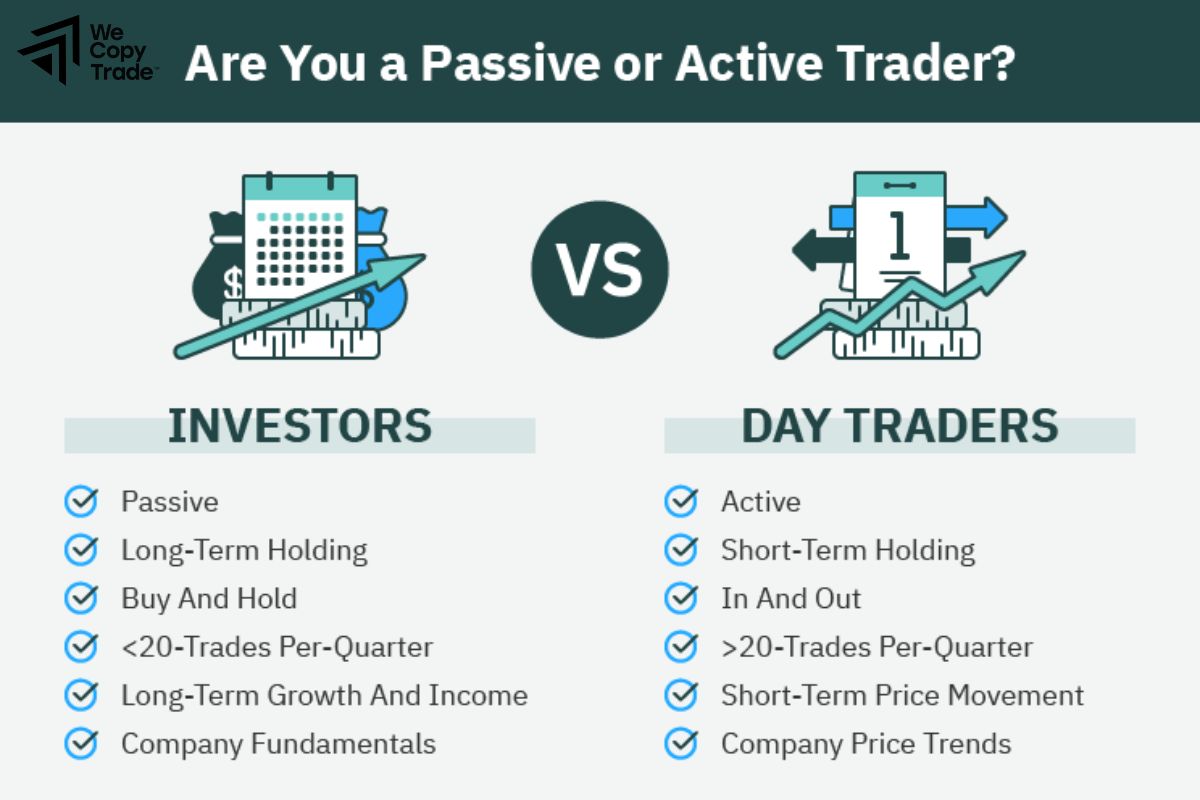
The main difference between a passive investor and a position trader lies in their investment goals, strategies, and time horizons:
| Criteria | Passive Investor | Position Trader |
| Holding Period | Long-term (years) | Medium to long-term (weeks to months) |
| Investment Strategy | Buy and hold, stable assets | Based on trends and market analysis |
| Activity Level | Low, minimal trading | Active, monitors and adjusts trades |
| Risk Tolerance | Low, stable investments | Higher, seeks higher returns |
| Trading Frequency | Rarely trades | Trades more often, not daily |
| Market Involvement | Limited involvement | Regular analysis and decision-making |
| Asset Selection | Index funds, large-cap stocks | Stocks, crypto, commodities based on trends |
Conclusion
In conclusion, Position Trading is a strategic approach that allows traders to capture long-term market trends with a focused, patient mindset. By leveraging technical and fundamental analysis, position traders can make informed decisions to maximize profits while managing risks. Ready to take your trading to the next level? Start exploring today and unlock the potential for long-term success. Take action now and begin your journey to smarter, more effective trading!
See now:





