












You must have seen the squiggly lines that move up and down on stock charts. Those are called the zigzag indicator. It is a useful tool that allows you to analyze previous price changes and identify trends and patterns. This article will go over the definition of the zigzag indicator, its benefits and limitations, and strategies with it.
What is the Zigzag Indicator? How Does It Work?
The Zigzag indicator is a basic technical analysis tool that traders use to interpret the price change of a stock or other security to spot patterns and trends. It aids in spotting price swing points that serve as support and resistance areas, and thus, filters out unessential price fluctuations that may create noise.
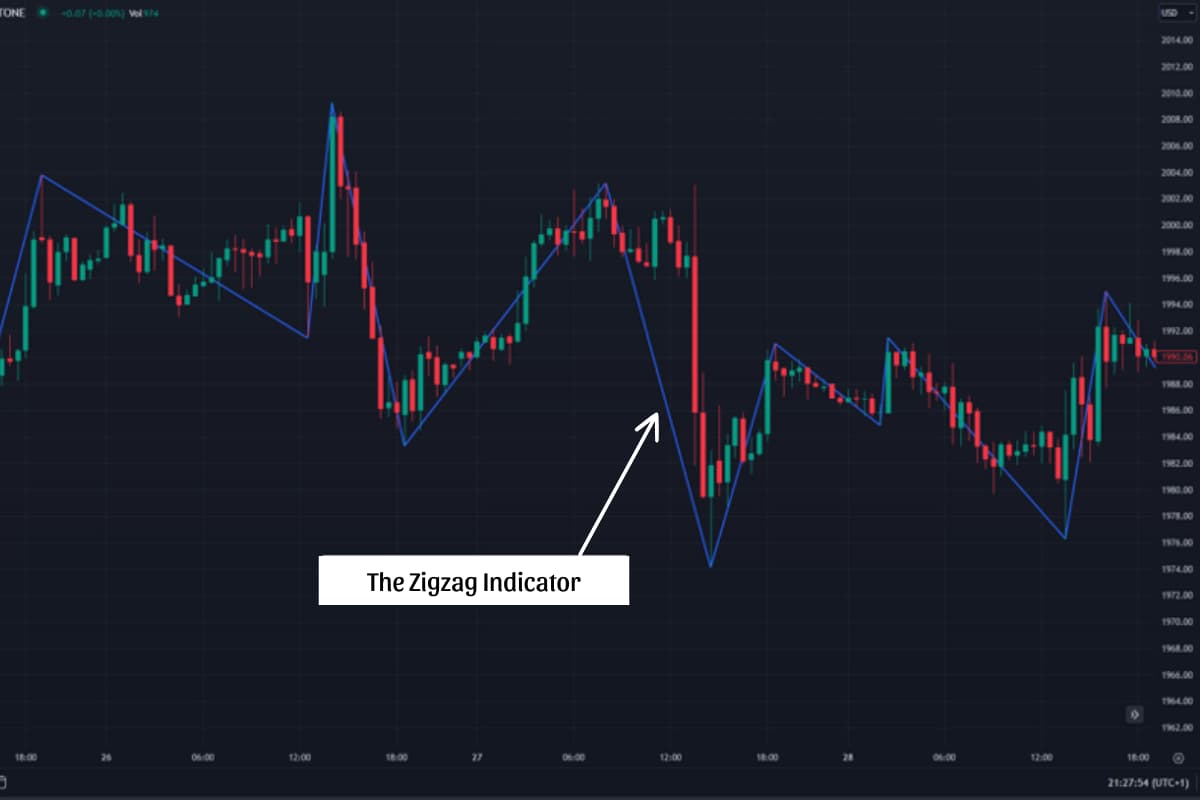
The indicator works by selecting an initial swing high or low as a starting point on the chart. It then draws a straight connecting line in the direction of the trend until the price moves in the opposite direction by a predetermined percentage amount, at which point it plots another point.
If the threshold is not met, the line continues extending in the existing direction of movement. In this way, the zigzag indicator functions to help traders visualize price trends by delineating significant highs and lows with its connecting line segments.
Benefits of the Zigzag Indicator
Here are the main advantages of the Zigzag indicator:
Filter out market noise
The zigzag filters out the small, insignificant price movements. This “noise” can distract you from the main trend. Ignoring small swings gives you a clearer picture of whether prices are trending up or down. It is like smoothing out the bumps in the road so the general direction is clearer.
Identify and follow trends
The zigzag indicator helps traders see the overall direction of the market by connecting important high and low price points over time. This makes the prevailing trend clearer. Traders can align their transactions with the trend and then increase the possibility of successful deals.

Enhance clarity and accuracy
By filtering out small, insignificant price moves, the Zigzag indicator simplifies the chart so traders can more easily identify meaningful levels of support and resistance where prices are consistently flattened or reversed.
Time entry and exit points
Another benefit of the Zigzag indicator is that it helps traders time entry and exit points. Pullbacks against the trend and potential reversals it spotlights provide traders opportunities to enter while signifying when a trend may be ending as possible exit signals.
Recognize trend reversals and chart patterns
By charting the ups and downs of prices, the Zigzag indicator can assist in noticing changes in direction and spotting common patterns like double tops, which commonly form before large price changes.
Zigzag Indicator Trading Strategy
Here is a potential trading strategy using the Zigzag indicator:
Identify the trend
You will need to analyze the Zigzag lines on the chart to determine if there is an upward, downward, or sideways trend. The direction and steepness of the lines provide some clues about the trend.
Locate entry opportunities and set entry orders
Look for pullbacks or retracements, where the price moves against the trend within an established channel. These periods of reversal can present lower-risk entry points. Place a buy-stop order above the latest zigzag high or a sell-stop below the latest low to enter long or short at those support/resistance levels if broken.

Use moving averages (MA) for confirmation
You need to check to see if the short-term moving average is crossing above/ below the long-term moving average. This crossover can help you confirm whether the trend shown by the zigzag lines is indeed changing directions. This will provide an additional confirmation signal of the new direction of the trend.
Set protective stops
Place stop-losses just outside the latest swing high/low to minimize losses if the trade moves against you. Tighten stops as the trade progresses.
Take profits at resistance
Cash out some or all of your position as the price gets close to the following zigzag line on the chart. This next line frequently creates barrier-like resistance that may indicate a trend reversal is impending. Taking profits at this point can lock in gains ahead of a potential trend change.
Combine various timeframes
It is advisable to use the Zigzag indicator on multiple timeframes. You can choose timeframes like daily, hourly, etc. to get a broader perspective of the market trend. When you align the signals from various timeframes, you can significantly improve the timing of your trades and avoid entering positions against the dominant trend.

How to incorporate the Zigzag indicator into a trading plan?
Traders can incorporate the Zig Zag Indicator into their trading strategy. Here is how:
- Add it to the charting platform for real-time analysis.
- Develop trading rules that define how signals from the indicator will guide their entry, exit, and risk management approaches. Common techniques include waiting for moving average confirmations of zigzag trend indications or entering retracement moves off zigzag lines.
- Refine their integration of the indicator by backtesting hypothetical trades on historical data. This allows optimizing indicator parameters and evaluating the efficacy of various trading rules based on zigzag signals. With testing and refinement, the indicator can be systematically factored into rules-driven strategies.

Limitations of the Zigzag Indicator
While the Zigzag indicator has outstanding advantages that help traders identify trends, it also comes with several limitations:
- Lagging indicator: It is reliant on past price data and does not predict future price movements. Trends may change before new zigzag lines are formed.
- Customization dependent: Optimal settings can vary between assets and markets. Requires trial and error to find the best percentage parameters.
- False signals possible: Sharp but brief price spikes could trigger zigzag lines despite not confirming an emerging trend. May generate some misleading signals.
- Overly simplified view: By filtering out minor moves, some context is lost. May not capture more complex chart patterns or consolidation periods.
Inability to predict future trends: Like all technical analysis tools, it is based on historical price data and does not account for fundamental factors or unexpected events.
FAQs about the Zigzag Indicator
- How does the Zigzag indicator work?
The Zigzag indicator places points on the price chart whenever prices change direction by an amount greater than a predefined percentage value. It then connects these points with straight lines. This filters out smaller price fluctuations and highlights significant reversals.
- Is the Zigzag indicator predictive?
No, the Zigzag indicator is not predictive. It analyzes past price data and relies on hindsight. It helps to understand previous swing patterns and trends but cannot forecast future highs and lows.
- Can the Zigzag indicator be adjusted?
Definitely! The Zigzag indicator allows customization by adjusting the percentage used to determine price movement. Traders typically experiment with values like 5-10% and choose the setting that provides the clearest picture of the stock under examination.
Final Words
To sum up, the Zigzag indicator is a valuable tool for identifying trends, reversals, and price movements. By understanding how it works and integrating it into a comprehensive trading strategy, you can harness its power to make informed trading decisions. For further trading advice, please visit https://wemastertrade.com/blog/.





