












Do you know how to calculate the maximum profit possible? Let’s learn how to logically analyze the indicators and from there evaluate whether your investment strategy and decisions are really safe. Don’t miss the following article, I will summarize and share all the secrets about Yield Curve for you!
What is the Yield Curve?
Imagine you want to borrow money. If you borrow a small amount of money for a short period of time, you will pay a lower interest rate than if you borrow a large amount of money for a long period of time. This is simply because the lender faces a greater risk in lending you money for a long period of time.
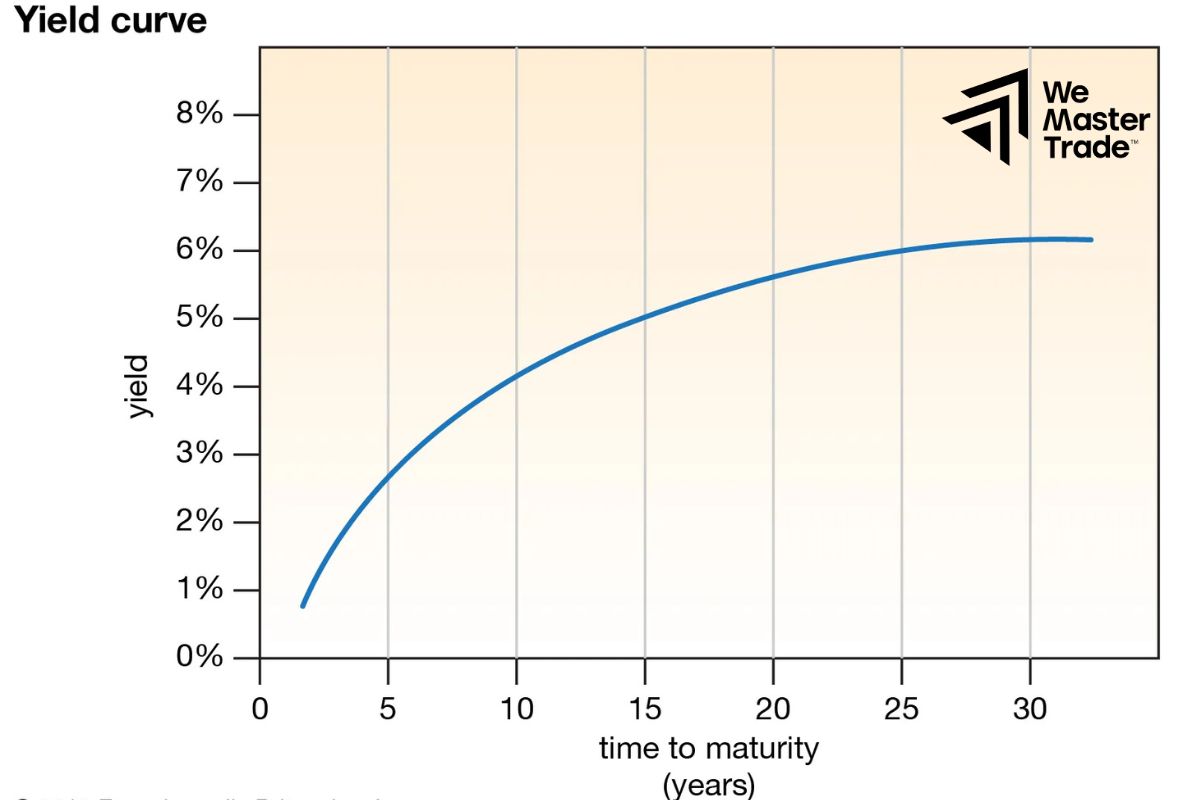
The yield curve is a graph that shows the relationship between the length of the loan and the interest rate you pay.
For example, if we draw a graph with the horizontal axis representing the loan period (from short term to long term) and the vertical axis representing the interest rate, the yield curve will give us a clear picture of the interest rates we pay for loans of different durations.
See now:
How To Contribute A Good ISM Manufacturing Index In Trading
The Importance of Interest Rate Forecasting In Trading
Planning To Measure The PMI For Your Successful Trading
Advantages and risks of using a yield curve
The yield curve is an extremely useful analytical tool in investing, however, like any other tool, it also comes with certain advantages and disadvantages.
Advantages
The yield curve helps investors predict upcoming fluctuations in the market. For example, an inverted yield curve is often considered a warning signal of an economic recession.
By comparing yields across different maturities, investors can assess the risk level of their investments.
The yield curve helps investors build a portfolio that suits their goals and risk tolerance.
It also reflects the impact of monetary policies on the economy.
Risk
Unexpected events such as economic crises, wars, or sudden policy changes can cause the yield curve to change in an unpredictable manner.
Changes in market structure, such as the introduction of new financial products or changes in regulation, can also reduce the reliability of yield curve-based forecasting models.
In reality, investors do not always act rationally. Fear, greed, and other emotional factors can lead to investment decisions that are not based on technical analysis.
Yield curves may not detect emerging asset bubbles until it is too late.
Types of Yield Curves
The yield curve, as a road map for the economy, can take on many different shapes. However, there are three main shapes that are often mentioned:
Upward-sloping yield curve
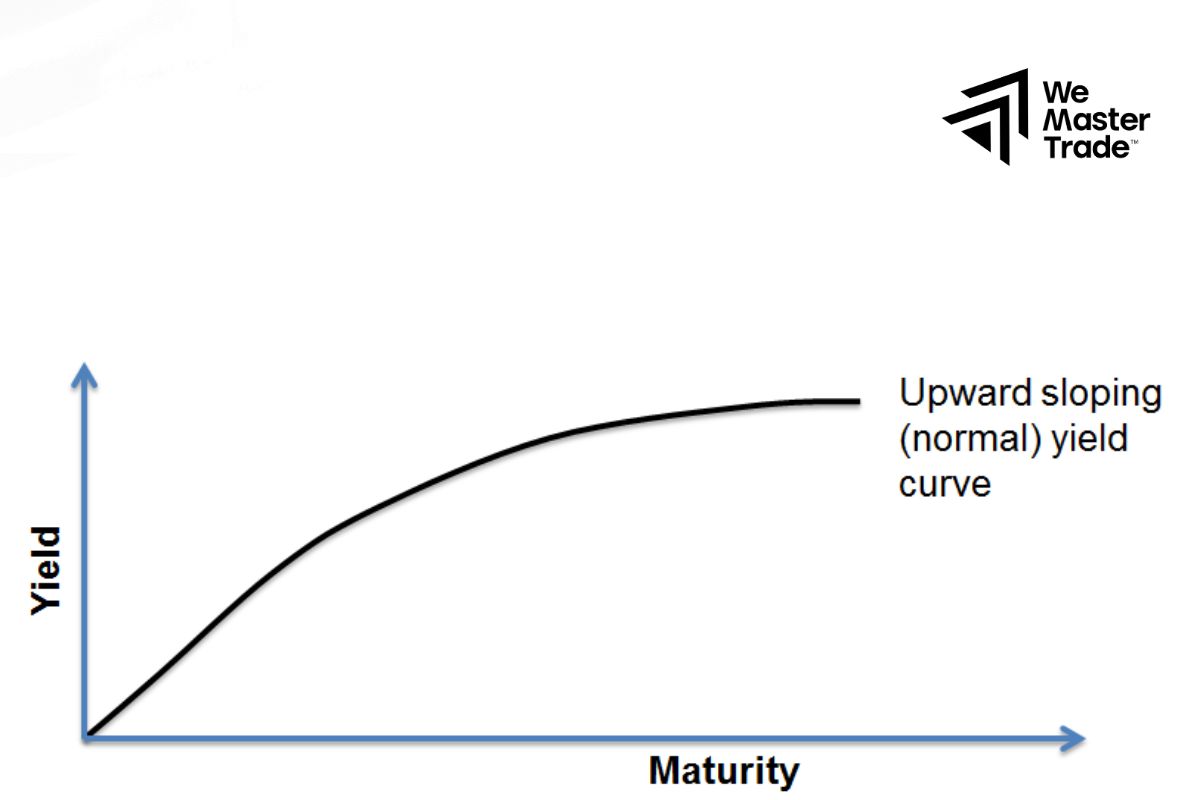
This is the most common shape, resembling a small mountain. This means that you pay a higher interest rate when borrowing money for a long period than for a short period. Why is this? Because when borrowing money for a long period, lenders face more risks, such as higher inflation or economic volatility. To compensate for this risk, they will demand a higher interest rate. An upward-sloping curve usually shows that the economy is growing steadily and investors are optimistic about the future.
Inverted yield curve
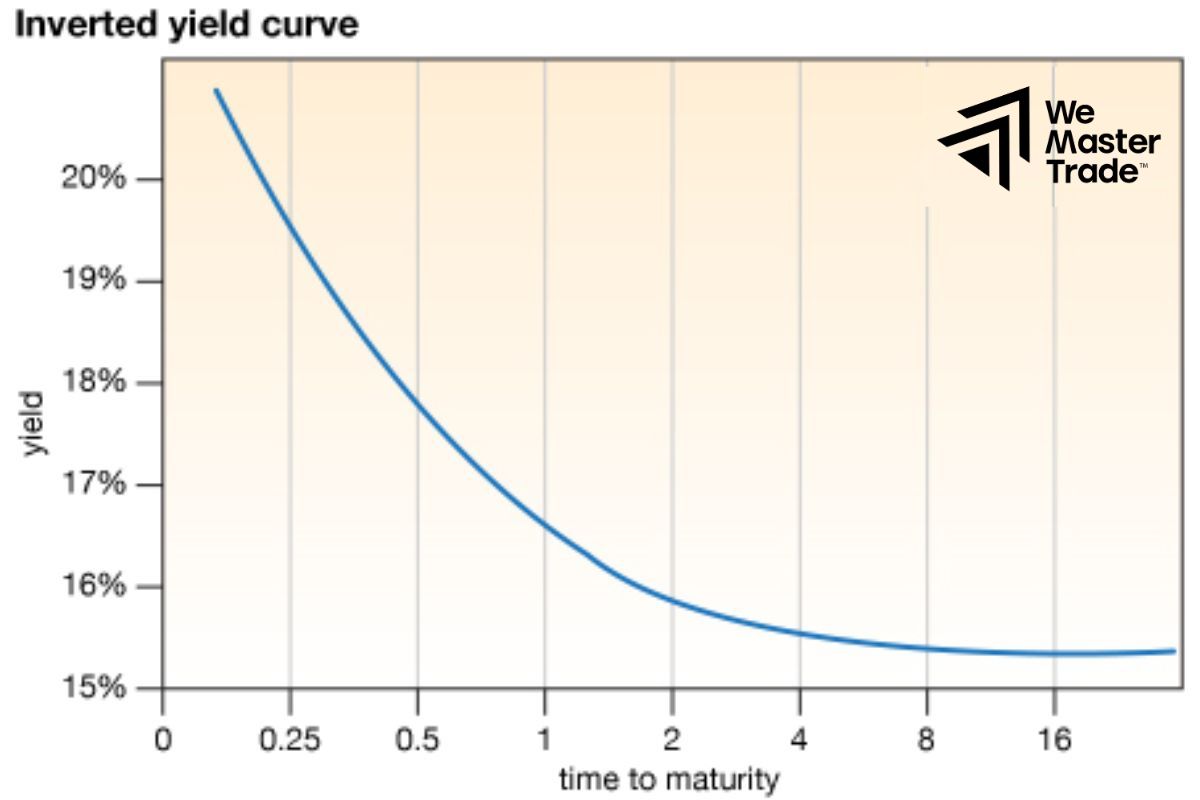
This is a warning sign. It resembles an upside-down mountain, meaning that short-term interest rates are higher than long-term interest rates. This means that investors are worried about the future, expecting a recession and lower inflation. Therefore, they are willing to lend at lower interest rates in the long term to attract borrowers.
Flat yield curve
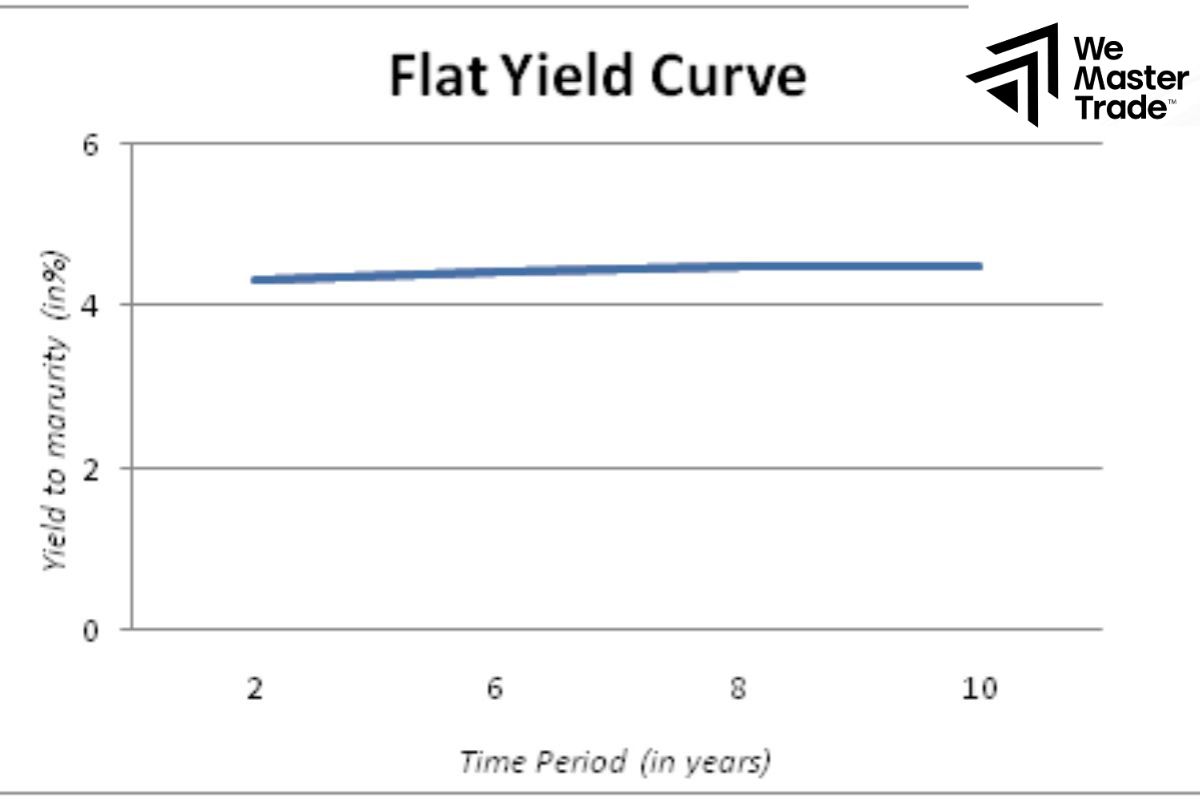
The shape of this curve is almost a straight line, meaning the difference between short-term and long-term interest rates is very small. Flat curves often appear during transitional periods of the economy, when investors are uncertain about the future.
Typically, the curve is upward sloping, meaning that long-term interest rates are higher than short-term interest rates. This makes sense, because the longer you keep your money in the bank, the higher the interest rate you earn to compensate for the risk and other investment opportunities you miss. There are many reasons for this, but the two main ones that are often mentioned are:
- When the economy is overheating, the central bank may decide to raise short-term interest rates to cool the economy and control inflation. However, if the economy is showing signs of weakness, investors will be concerned about the future and will not want to invest in long-term loans. This causes long-term interest rates to fall, creating an inverted yield curve.
If investors expect the economy to decline in the future, they will not want to invest in long-term loans. Instead, they may park their money in short-term assets such as bank deposits for safety. This will push short-term interest rates higher than long-term interest rates.
Influencing Factors To Yield Curve
- Monetary policy: The central bank’s decision to raise or lower interest rates will directly affect the shape of the curve.
- Inflation: When inflation is high, the central bank often raises interest rates to control inflation, which can cause the curve to slope upward.
- Economic growth: When the economy grows strongly, the demand for loans increases, pushing interest rates up and causing the curve to slope upward.
- Investor expectations: Investor sentiment about the future of the economy also greatly affects the shape of the curve.
How to identify a yield curve?
To draw a yield curve, you need to follow these steps:
1. Gather data

Choose a bond type: Typically, people use government bonds because they have low credit risk and are actively traded in the market.
Collect yield data for bonds with different maturities, from short-term (e.g., 3 months) to long-term (e.g., 30 years).
Find data sources on financial websites such as Bloomberg, Reuters, or the websites of stock exchanges.
2. Draw a graph
The horizontal axis: represents the maturity of the bond (usually in years).
The vertical axis: represents the yield of the bond (usually in percentages).
Each data point on the graph represents a pair of values (maturity, yield) for a particular bond.
Connect the data points together and you will have a curve.
3. Curve Analysis
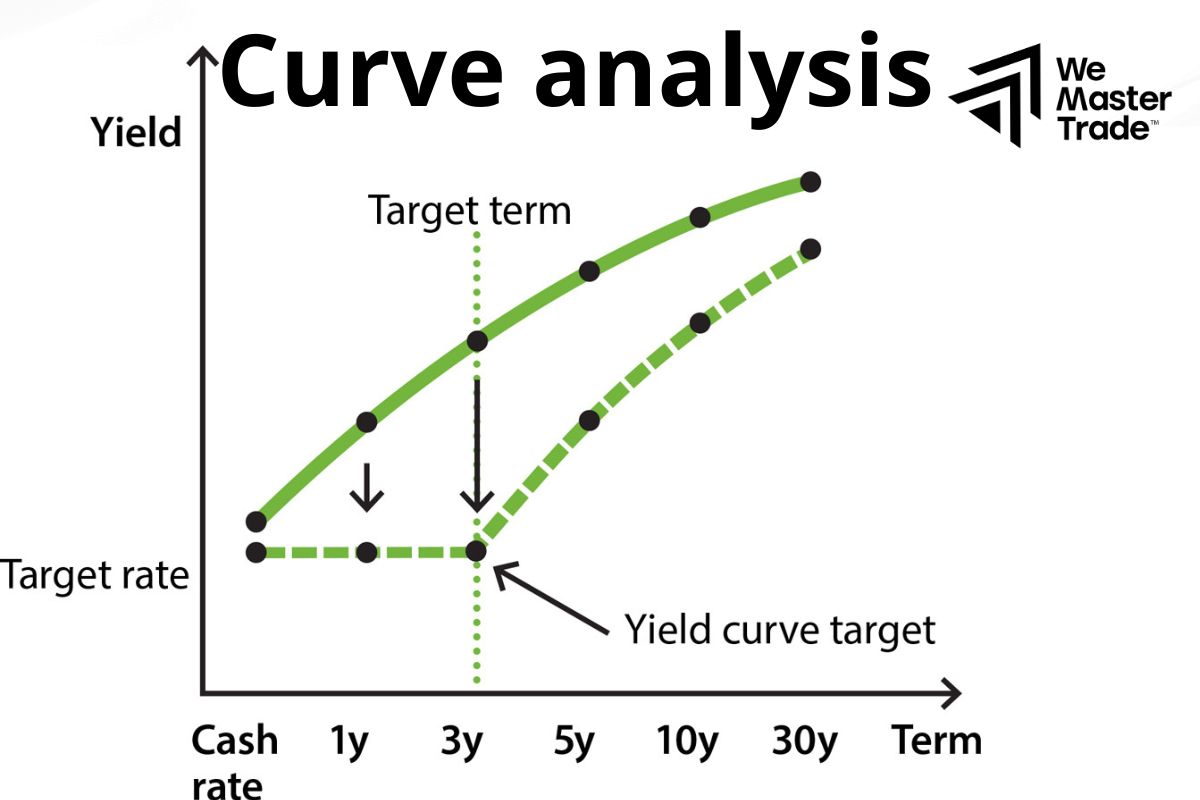
Upward sloping curve: Usually indicates that the economy is in a period of stable growth. Investors expect interest rates to rise in the future to counter inflation.
Inverted curve: Is a warning sign of a possible economic recession. When short-term interest rates are higher than long-term interest rates, this shows that investors are concerned about the future and expect interest rates to fall.
Flat curve: Indicates market uncertainty. The economy may be in a transitional period or investors are uncertain about future prospects.
After drawing, we need to analyze it to better understand the information it provides.
Conclusion
In conclusion, the yield curve is an effective tool that helps us more clearly measure the effectiveness of investment strategies. However, we should not abuse it blindly. Investors should combine the yield curve with other analytical tools and market information to make wise investment decisions.
See more:
What is the Trade Balance? How to Calculate Balance Trading
What is a Contractionary Policy? Tools Used for Policies





