













The Cryptocurrency (Crypto) market is often compared to the “Wild West”: extremely volatile, operating 24/7, and heavily manipulated by massive “Whales.” If you only look at basic candlestick charts on centralized exchanges (CEXs) like Binance or Bybit, you’re essentially trading in the dark.
To survive and generate consistent profits, you need a professional crypto charting tool equipped with powerful TradingView crypto indicators that clearly reveal market structure and capital flow. And no name stands above TradingView.
Moreover, TradingView is a versatile platform built around a comprehensive ecosystem of TradingView crypto indicators and advanced charting tools. If you trade across multiple markets, you can also use it for TradingView Forex analysis on currency pairs, or to hunt for high-potential equities with TradingView Stocks, while still relying on TradingView crypto indicators for crypto-specific market behavior.
However, focusing back on Crypto, below are the Top 5 TradingView crypto indicators designed to help you catch major Altcoin waves and avoid brutal Bitcoin crashes. These TradingView crypto indicators are widely used by professional traders to analyze trends, liquidity, and market psychology.
1. Bitcoin Dominance (BTC.D) – The “Compass” of Capital Flow

Although not a traditional indicator, this is one of the TradingView crypto indicators in macro-data form that you must analyze first before entering any trade.
- How to open: Type BTC.D in the search bar.
- Meaning: Measures Bitcoin’s market capitalization dominance compared to the entire crypto market.
- Golden rule (Altcoin Season): When BTC.D drops sharply + BTC price moves sideways or slightly up = Altcoin Season (Capital rotates into Altcoins → High probability of exponential account growth when confirmed by TradingView crypto indicators).
2. Hash Ribbons – A Long-Term “Bottom-Fishing” Indicator
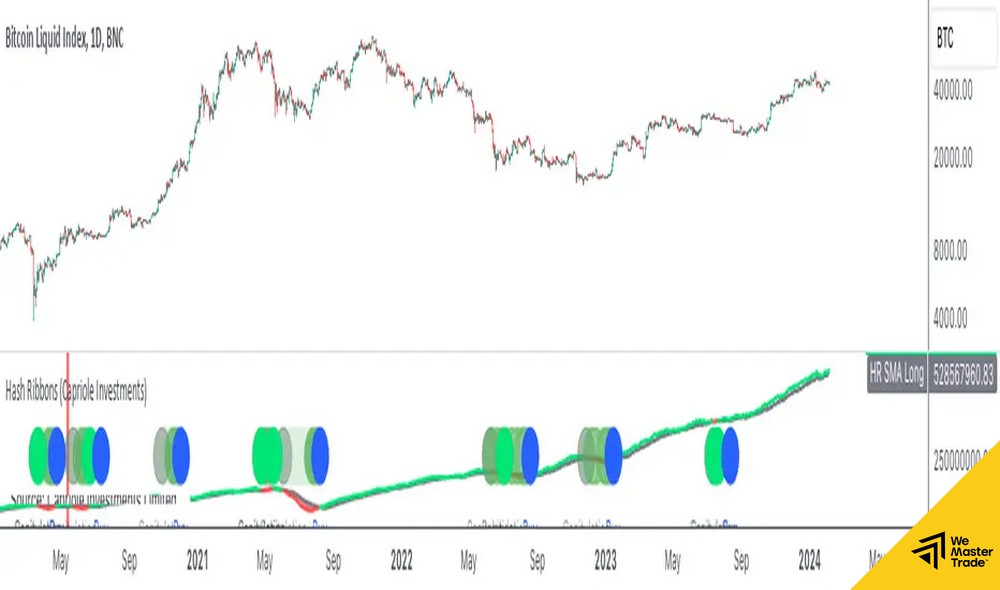
This is a TradingView-exclusive feature and one of the most respected TradingView crypto indicators among Holders and Swing Traders searching for safe long-term entry zones.
- Mechanism: Based on Bitcoin’s Mining Difficulty and Hashrate. When miners capitulate due to unprofitability, it often marks a market bottom.
- Signal: When a green circle with “Buy” appears, historical data shows Bitcoin frequently enters a powerful bull run shortly after, making it one of the most reliable TradingView crypto indicators for long-term investors.
3. Volume Profile Visible Range (VPVR) – Whale Liquidity Zones
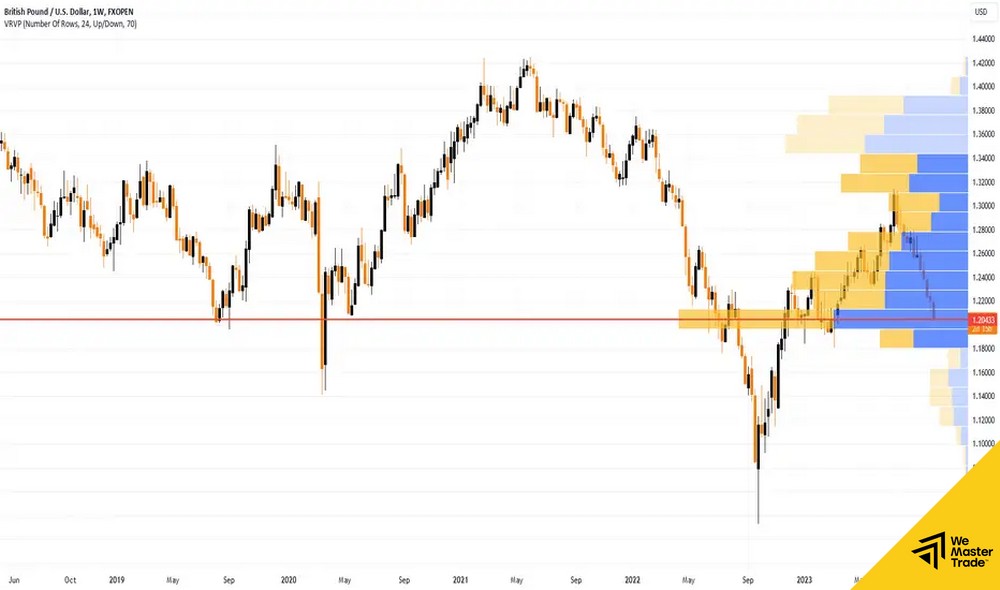
In Crypto, Volume is king, and VPVR is one of the most powerful TradingView crypto indicators for visualizing volume distribution by price rather than time.
- POC (Point of Control): The longest red line — the price level with the highest trading volume (a price magnet).
- Low-volume areas: Zones where price moves very fast (Pump/Dump).
- Benefit: Helps you identify optimal levels to place Limit Orders and trade alongside institutional capital and whales using TradingView crypto indicators based on real volume data.
4. Crypto Fear & Greed Index
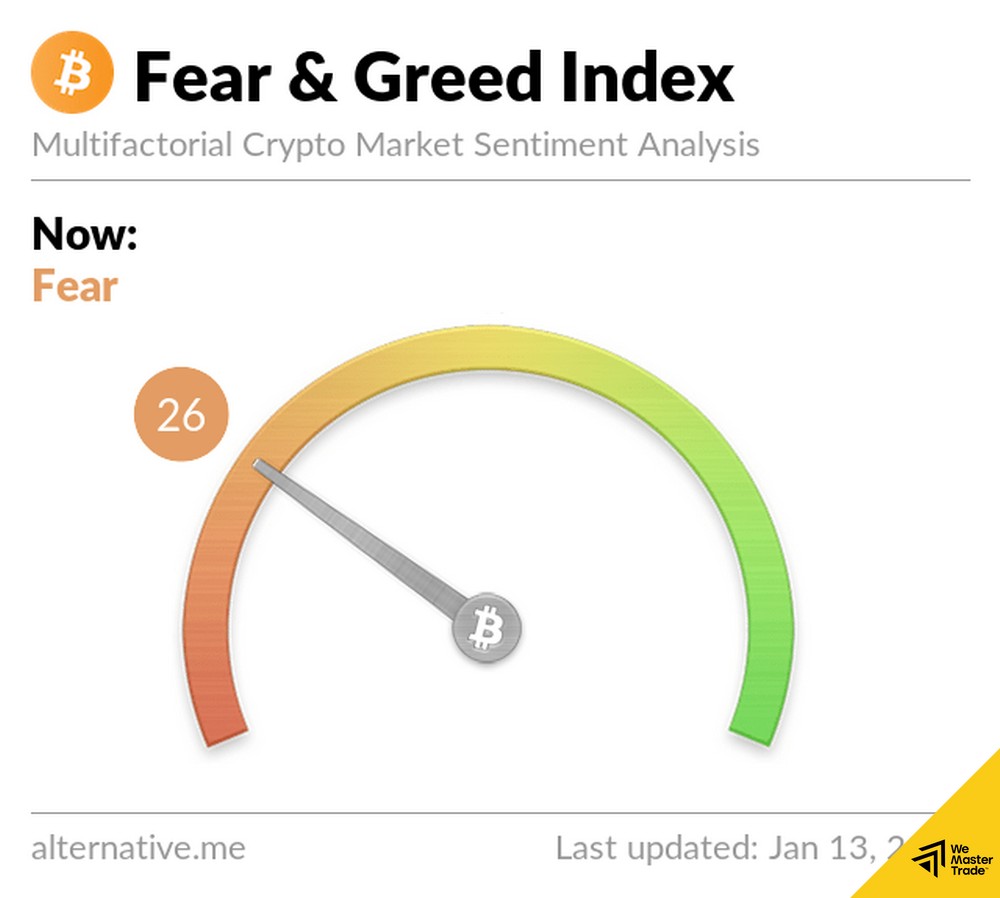
On TradingView, many community-built scripts integrate this sentiment metric directly into the chart, turning it into one of the most popular TradingView crypto indicators for measuring emotional extremes.
- Principle: “Be greedy when others are fearful.”
- How to use: Accumulate when the index is below 20 (Extreme Fear); Take profit or Short when above 80 (Extreme Greed).
5. Relative Strength Index (RSI) + Divergence
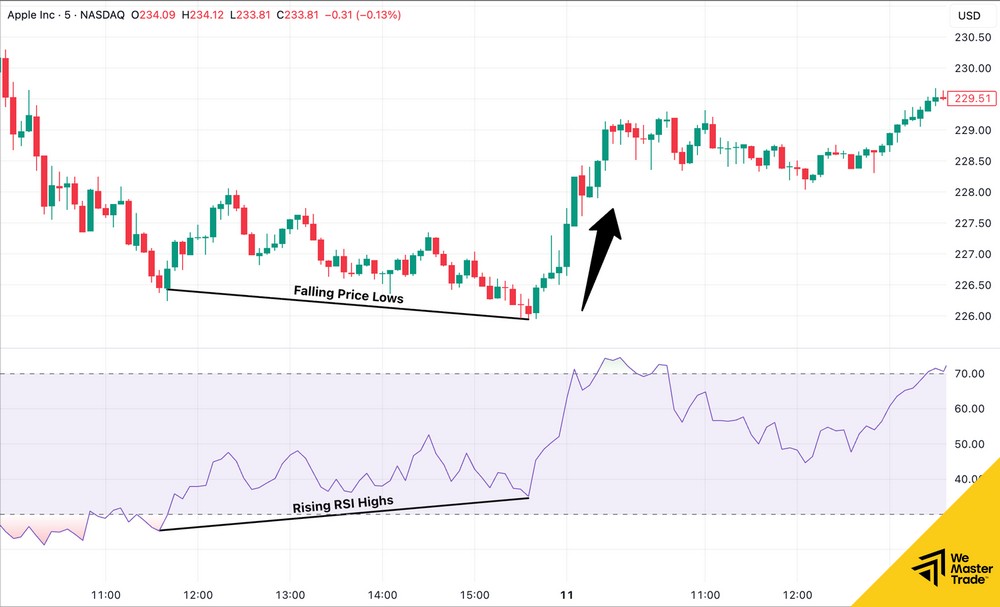
Crypto markets move fast, and RSI remains one of the most essential TradingView crypto indicators for identifying potential market tops and bottoms through Divergence.
Example: When Bitcoin makes a higher high, but RSI forms a lower high → Bearish Divergence
→ A sign that whales are quietly distributing → A potential sharp crash ahead.
Hybrid Strategy: Analyze on TradingView – Trade with WeMasterTrade
TradingView is an exceptional crypto charting tool for analysis using advanced TradingView crypto indicators. However, trade execution is a different challenge. Many traders hesitate between trading directly on TradingView or using traditional platforms such as MT4 or MT5.
To fully understand the pros and cons, you should read this detailed comparison:
TradingView vs MT4/MT5: Which platform is the best?.
At WeMasterTrade, we encourage a hybrid solution:
- Analysis: Use TradingView with the 5 indicators above to identify trade entries.
- Execution: Trade Crypto CFDs using WeMasterTrade’s MT5 platform.
Benefits of Trading Crypto with a Prop Firm:
- Short selling: Easily profit during market crashes (very difficult on Spot exchanges).
- Large capital: Instant Funding up to $200,000.
- Safety: No risk of CEX collapses (like FTX) or personal wallet hacks.
The Crypto market is not for beginners. Equip yourself with a powerful set of TradingView crypto indicators to truly understand and anticipate market movements.





