












Unlike MetaTrader 4 (MT4), which has only about 30 default tools, TradingView owns a massive library with more than 100,000 TradingView indicators programmed by the community itself (Pine Script).
This is both an advantage and a “maze” that makes new Traders easily lose their way. Which one should you use among thousands of flashy choices?
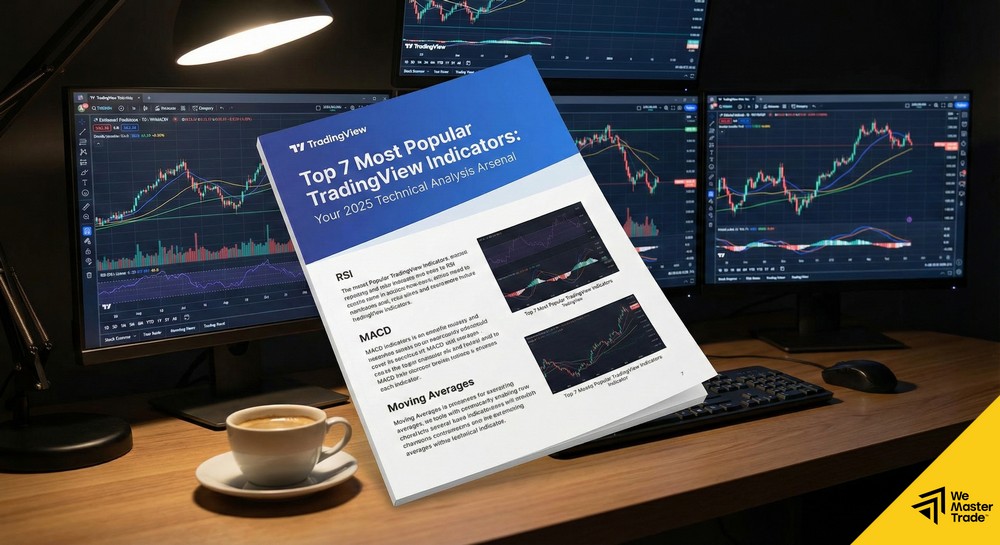
At WeMasterTrade, we encourage Traders to simplify their systems. Below is a curated list of the best TradingView indicators (the best and most popular) voted by the global Trader community, divided into 2 groups: Classic and Exclusive.
Group 1: Classic indicators (Built-in)
These are foundational tools, available everywhere but displayed most beautifully and smoothly on TradingView.
1. Relative Strength Index (RSI)
Indispensable in every list.
-
Function: Measures the strength of Buyers and Sellers.
-
Why use it on TradingView? RSI on TradingView allows you to customize the background color of the 30–70 zone very intuitively, and you can set Alerts when RSI reaches overbought/oversold levels that are sent straight to your phone.
-
Suitable for: Traders trading reversals (Reversal).
2. Exponential Moving Average (EMA)
-
Function: Smooths price to identify trends.
-
Common usage: The “Golden Cross” combo between EMA 50 and EMA 200.
-
Strength: On TradingView, you can use bundled code versions (e.g., “4 EMA”) to display 4 EMA lines at the same time with just 1 indicator slot (Saving slots for free accounts).
3. Bollinger Bands
-
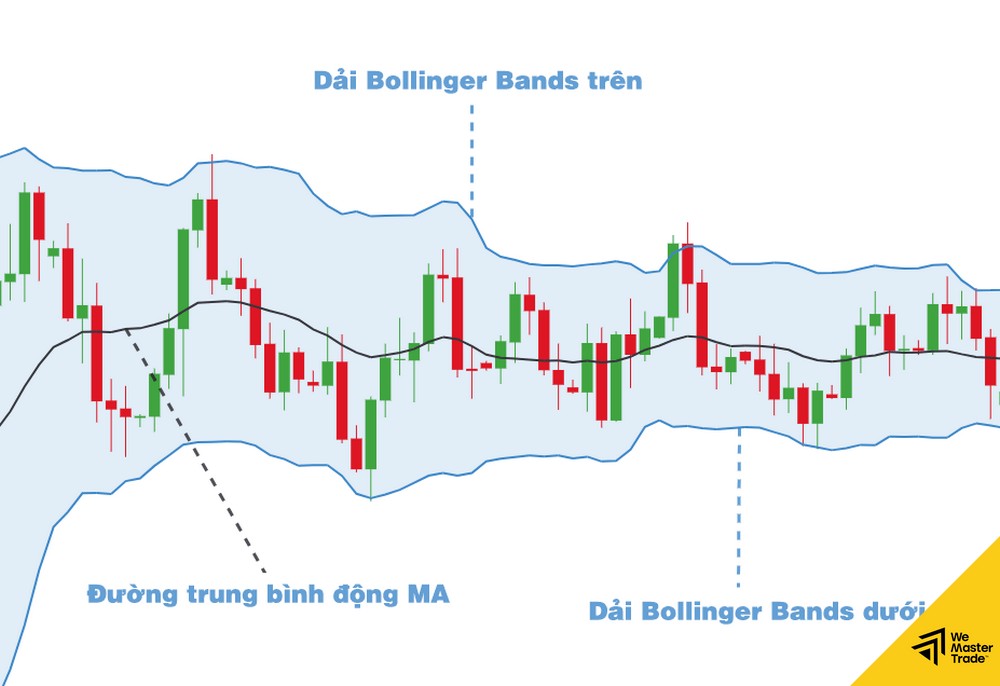
Function: Measures market volatility (Volatility).
-
Signal: The bottleneck (Squeeze) signals that a price storm is coming. TradingView displays the soft cloudy bands of Bollinger very gently on the eyes, helping you see candles more easily compared to the rigid drawings on MT4.
Group 2: Exclusive indicators from the community (Community Scripts)
These are “specialties” available only on TradingView, written by top developers in Pine Script. These are truly the best TradingView indicators that you must try.
4. Squeeze Momentum Indicator (by LazyBear)
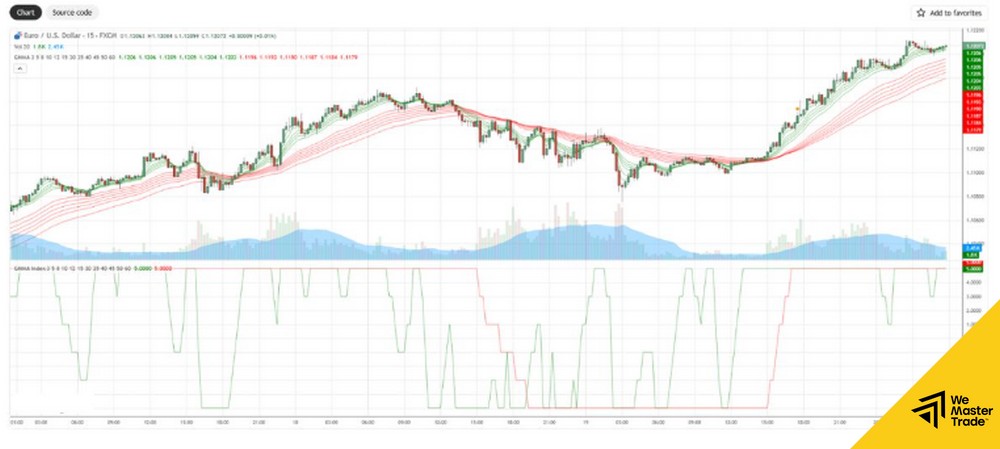
This is one of the most famous indicators on TradingView with hundreds of thousands of likes.
-
Mechanism: A combination of Bollinger Bands and Keltner Channels.
-
How to use: Red dots on the zero line signal the market is in a squeeze. When the dots turn green or gray + the Histogram explodes → Price breaks out strongly.
-
Evaluation: Excellent at catching big waves, filters noise better than traditional MACD.
5. Smart Money Concepts [LuxAlgo]
If you follow the SMC (Smart Money) school, this is a “holy” tool that saves 90% of chart-drawing time.
-
Features: Automatically draws market structures: BOS (Break of Structure), CHoCH (Change of Character), Order Block, and FVG (Fair Value Gap).
-
Benefits: Helps you quickly spot the footprints of the “Sharks” (Big Boys) without straining your eyes candle by candle.
6. Volume Profile Visible Range (VPVR)
-
Note: Usually only for paid (Pro) accounts, but there are free community versions.
-
Difference: Regular Volume is at the bottom of the chart (calculated by time). Volume Profile is horizontal (calculated by price levels).
-
Function: Identifies price levels with the highest traded volume (POC – Point of Control). These are extremely strong resistance/support levels of financial institutions.
7. Supertrend
-
Function: For beginners who like simplicity.
-
How to use: The indicator changes color Green (Buy) or Red (Sell) directly on the price line. It works like a dynamic Trailing Stop.
-
Limitation: Do not use when the market is sideways (Sideway) because it will be noisy.
Quick comparison table: Which Indicator should you choose?
| Trading style | Suggested Best TradingView Indicators | Goal |
| Trend Following (Trading with the trend) | Supertrend, EMA Cross, MACD | Ride the entire long wave, avoid catching tops and bottoms |
| Scalping (Short-term scalping) | Squeeze Momentum, Stochastic | Enter fast, exit fast, exploit small fluctuations |
| Price Action / SMC | Smart Money Concepts [LuxAlgo], Volume Profile | Follow big money flow, find sniper entry points |
| Reversal (Catching reversals) | RSI (combined with Divergence), Bollinger Bands | Buy bottoms, sell tops at extreme zones |
Advice from WeMasterTrade: From Analysis to Live Trading
Owning a set of premium TradingView indicators is only the first step. Many Traders analyze very well on TradingView (because charts look great), but when placing trades on MT4/MT5 they still lose due to poor psychology and risk management.
At WeMasterTrade, the process of a Pro Trader is usually:
-
Analysis: Use TradingView with SMC or Squeeze Momentum indicators to find entry points (Entry) and stop loss points (Stoploss).
-
Execution: Open WeMasterTrade’s MT5, calculate the appropriate lot size according to risk.
-
Entry: Place orders and strictly follow discipline.
Don’t let your sharp analyses stay only on paper.





