













Technical analysis is essential in enabling traders in the fast-paced financial markets of today to understand price swings and forecast future trends. Among the many pricing patterns and models, the Three- Drive model has attracted a lot of interest for its dependability and capacity to project market reversals. This article investigates the beginnings and development of technical analysis models, investigates the details of the Three-Drive pattern, shows how to spot it on charts, and clarifies successful trading techniques. At last, we draw potentially significant implications for traders applying the Three-Drive approach in their trading activities.
Overview of Three-Drive Strategies
Technical analysis has a lengthy history, dating back to the early twentieth century, when traders started using price charts to forecast market behavior. Pioneers like as Charles Dow established charting methods, while subsequent specialists, notably Ralph Nelson Elliott, created the Elliott Wave Principle to explain the cyclical nature of market movements.
The Three-Drive model, which is a derivative of these early ideas, grew throughout time as traders sought more tools to optimize their entry and exit strategies. Its growth is strongly related to the evolution of harmonic patterns and Fibonacci-based retracement approaches.
The Three-Drive model is a characteristic pattern on the price chart that consists of three successive waves or drives. These drives appear as three different peaks or troughs that correspond to various Fibonacci ratios and time periods. What distinguishes the Three-Drive model is its ability to accurately predict market reversals. However, like with every trading model, it has benefits and limits that every trader should be aware of before using it in real-world circumstances.
What Is the Three-Drive Strategies?
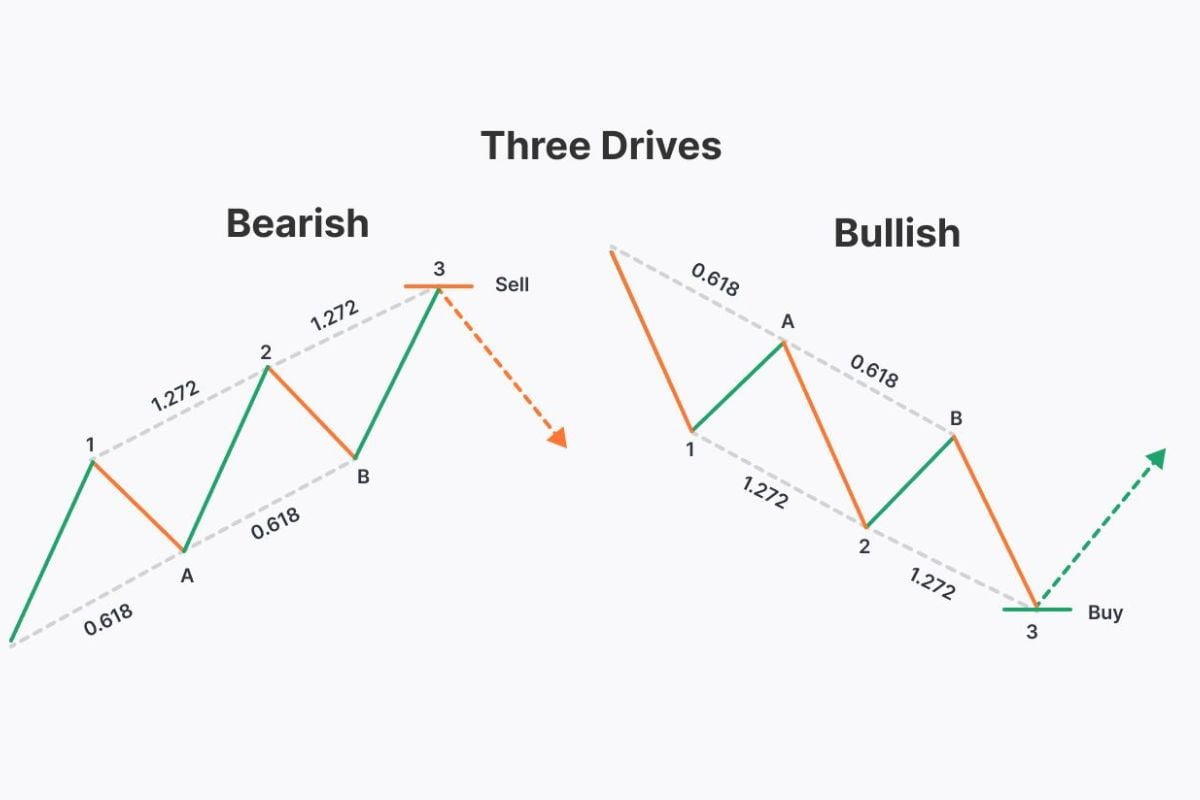
The Three-Drive model is a technical analysis pattern made up of three successive price impulses or drives. Each drive is often followed by a Fibonacci-based retracement wave. The pattern is based on the ideas of Elliott Wave Theory and harmonic trading. It is thought that the market moves in cycles, which may be determined by looking for recurrent wave formations. The Three-Drive model is typically credited to traders who expanded on Elliott’s discoveries by using Fibonacci measuring methods to improve the pattern’s forecasting effectiveness.
Key Characteristics
- Three consecutive drives: The pattern is characterized by three different price movements. In a bullish situation, there would be three rising peaks, whereas in a negative one, they would be three dropping bottoms.
- Fibonacci ratios: The retracement between the drives often corresponds to Fibonacci ratios: Fibonacci levels, such as 61.8%, however the expansions of the drives may reach levels such as 127.2% or 161.8% of the previous retracement.
- Wave structure and symmetry: The drives are often proportional in terms of both time and price action, implying an underlying symmetry that supports the pattern’s validity.
Advantages
- High reliability: When all parameters are satisfied, the Three-Drive pattern is said to have a good track record of predicting market reversals, making it a dependable tool for technical traders.
- Accurate reversal prediction: The obvious structure of three consecutive drives allows traders to more confidently identify probable turning moments in the market.
Disadvantages
- Skill-intensive identification: Successfully detecting the Three-Drive pattern requires a thorough grasp of both Fibonacci ratios and wave analysis, making it difficult for novices.
- Time frame limitations: The pattern does not appear consistently across time periods. It may be less noticeable or vulnerable to noise in turbulent markets or lower-time frame charts.
How to Identify the Three-Drive Model on Charts
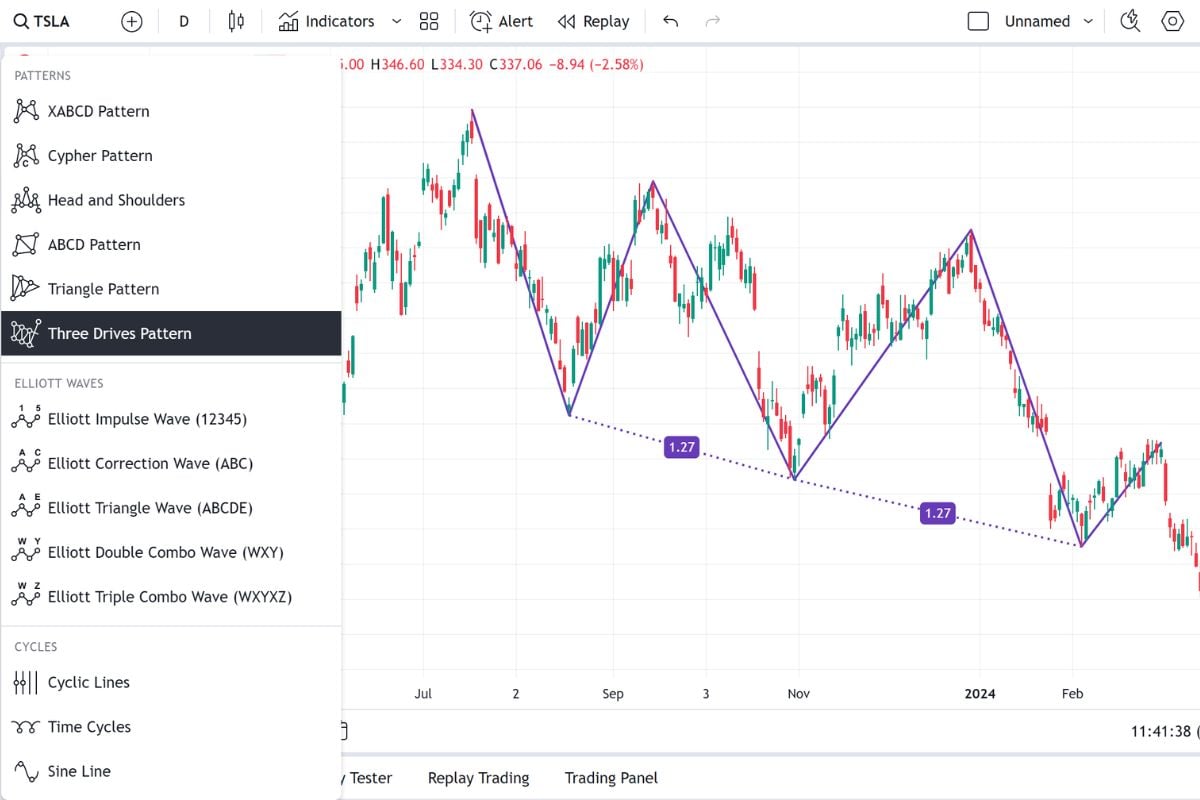
To recognize a Three-Drive pattern on a chart, traders need concentrate on a few key elements:
- Fibonacci measurements: To determine the correlations between waves, use Fibonacci retracement and extension techniques. The first retracement should be about 61.8%, with the succeeding drive reaching 127.2% or 161.8% compared to the prior retracement.
- Wave structure consistency: Look for three well-defined drives that have comparable structure and timing. Consistency in these aspects is critical for verifying the pattern.
- Time and price symmetry: Determine if the time intervals and magnitudes of the drives are symmetric. Discrepancies may suggest that the pattern is not consistent.
Imagine looking at a daily chart of a big currency pair. You can see three consecutive upward price swings. The price retraces around 61.8% of the first drive before starting a second one. This second push may stretch further and then withdraw once again, allowing a third, forceful upward movement. The third drive should indicate a shift in the trend when the price starts to slide or reverse. These levels may be confirmed and the pattern validated by using charting tools like Fibonacci tools.
Trading Strategy Using the Three-Drive Model
Before delving into the details, one must first realize that the Three-Drive strategies is a framework that can direct exact trade execution, not just a pattern to follow. Integrating the model with solid risk management helps traders improve their capacity to catch notable market swings.
Determining Entry Points
One of the Three-Drive model’s key uses is to identify suitable entrance places. Traders often initiate a trade after the third drive is complete and the price starts to reverse. This reversal is often verified by other indications such as candlestick patterns, oscillators (e.g., RSI or MACD), and volume signals. The pattern’s obvious structure helps traders to precisely establish entry positions, guaranteeing that the reversal occurs at the right time.
Set Stop-Loss and Take-Profit Levels
Risk management is critical to every trading strategy. To limit possible losses, stop-loss orders should be properly placed using the Three-Drive approach. For a bullish trade, the stop loss may be placed right below the end of the third drive. In contrast, a bearish trade may be made above the completion point. Take-profit levels may be calculated by projecting Fibonacci extension levels or recognizing major support and resistance zones on a chart. This method aids in boosting profits while safeguarding trading funds.
Risk Management and Position Sizing
Effective risk management extends beyond stop-loss and take-profit orders. Position size should be computed using the entire risk per transaction. Many expert traders risk no more than 1-2% of their account value on a single deal. This cautious approach aids in the management of total risk exposure, particularly when working with patterns that need accuracy and include an inherent amount of uncertainty. Traders may calculate how many lots or shares to trade by estimating the distance between the entry point and the stop-loss.
Or you can follow all of the above factors automatically by professional traders from the Wecopytrade platform to optimize profits in the fastest time.
Important Considerations for Traders Using the Three-Drive Model

While the Three-Drive model provides potential reversal signs, traders should use it with care and preparedness. Here are some key considerations to bear in mind:
Validate with Multiple Indicators
Using just the Three-Drive pattern may not be adequate. It is strongly advised to corroborate the signals using other technical indicators such as RSI, MACD, or volume analysis. This multi-indicator method reduces false signals while increasing confidence in the trade setting.
Practice on Historical Data
Backtest the Three-Drive technique against historical data before deploying it in real markets. This method will give insights on the model’s performance under various market circumstances, as well as assist modify the parameters for greater accuracy. To acquire confidence, practice using virtual trading platforms rather than risking actual funds.
Understand Market Conditions
The efficiency of the Three-Drive pattern varies according on market volatility and liquidity. During times of extreme volatility or when markets are primarily news-driven, the pattern may provide unpredictable signals. Traders should use caution and avoid employing the model in such circumstances, or at least alter their risk management tactics appropriately.
Be Aware of Time Frame Limitations
As previously stated, the Three-Drive pattern does not always emerge clearly in all time periods. It is more reliable on longer time scales, when price movement is smoother and less influenced by market noise. Traders utilizing smaller time frames should exercise additional caution and consider combining the pattern with other types of analysis.
Continuous Learning and Adaptation
Financial markets are dynamic, so what works today may not work tomorrow. Traders should commit to constant learning and alter their methods as market circumstances change. This might include adjusting the parameters of the Three-Drive model, integrating new indications, or even changing risk management principles.
Psychological Preparedness

Technical techniques, like the Three-Drive model, need a disciplined attitude. Emotional trading typically results in poor decision-making. Traders must maintain discipline, adhere to their plan, and avoid making rash judgments motivated by fear or greed. Developing a solid trading strategy with well defined entry and exit criteria might help alleviate these psychological obstacles.
Conclusion
Implementing the Three-Drive pattern in trading requires a thorough grasp of technical analysis and rigorous risk management. Traders should work hard to precisely recognize this pattern on charts. Combining the Three-Drive model with additional analytical techniques may improve trading performance. Continuous learning and flexibility to market changes are critical for success. Check out more our trading tips and join our trading program at: https://wemastertrade.com/





