












Supply and demand trading is a core concept in finance, acting like a fundamental tug-of-war between buyers and sellers. It’s based on the simple principle that an imbalance between a product’s availability (supply) and the public’s desire for it (demand) directly influences its price.
Recognize high-probability zones and make more informed decisions as a trader. Read on to find out more.
What is Supply and Demand Trading?
Supply and demand trading is a powerful way to understand financial markets. It’s kind of like a tug-of-war between buyers and sellers. When there’s high demand for something but not much of it is available, the price usually goes up. However, when there’s too much of something but nobody wants it, the price tends to fall. Traders using supply and demand look for these imbalances. They aim to buy only when the demand is strong, and sell when supply overflows. It’s all about finding where the “hidden” orders are, predicting price movements based on this economic principle.
If you’re a new trader looking to understand how to identify high-probability zones in supply and demand trading, read on and find out.
What is a High-Probability Zone?

A high-probability trading zone is a sweet spot on a price chart. It’s where everything lines up perfectly, meaning that the price of something is very likely to move in a predictable direction. Traders find these spots by analyzing the history of price movements and using technical indicators. These help them understand the market’s overall setup and allow them to trade in one of these zones. It poses high chances of earning more because they are clearly acting on smarter decisions and managing risks better.
Identifying High-Probability Zones
Support and Resistance Levels
High-probability zones often form at established support and resistance levels. These are price points where the market has historically reversed or struggled to break through. Look for areas where price has touched and bounced off multiple times, because these indicate strong buying or selling interest.
Trendlines

Drawing accurate trendlines can reveal dynamic support and resistance zones. In an uptrend, a rising trendline connects higher lows and acts as a support area. In a downtrend, a falling trendline connects lower highs and serves as resistance. Price retests of these lines often present high-probability entry points.
Moving Averages
Moving averages, particularly longer-term ones like the 50, 100, or 200-period, can act as dynamic support and resistance. When price pulls back to a respected moving average and shows signs of reversal, it often signals a high-probability zone for trend continuation.
Volume Analysis

When you see a stock’s price move, the volume tells you how many shares were traded during that move. Think of it like this: if a lot of people are buying or selling a stock (high volume) when its price hits a certain level and then reverses, it suggests that big players, like firms, are getting involved. That makes the price reversal more reliable. On the other hand, if a stock’s price breaks through an important level but hardly anyone is trading it (low volume), that move might not last. It’s like a small group of people pushing the price, and it doesn’t have strong support.
Candlestick Patterns
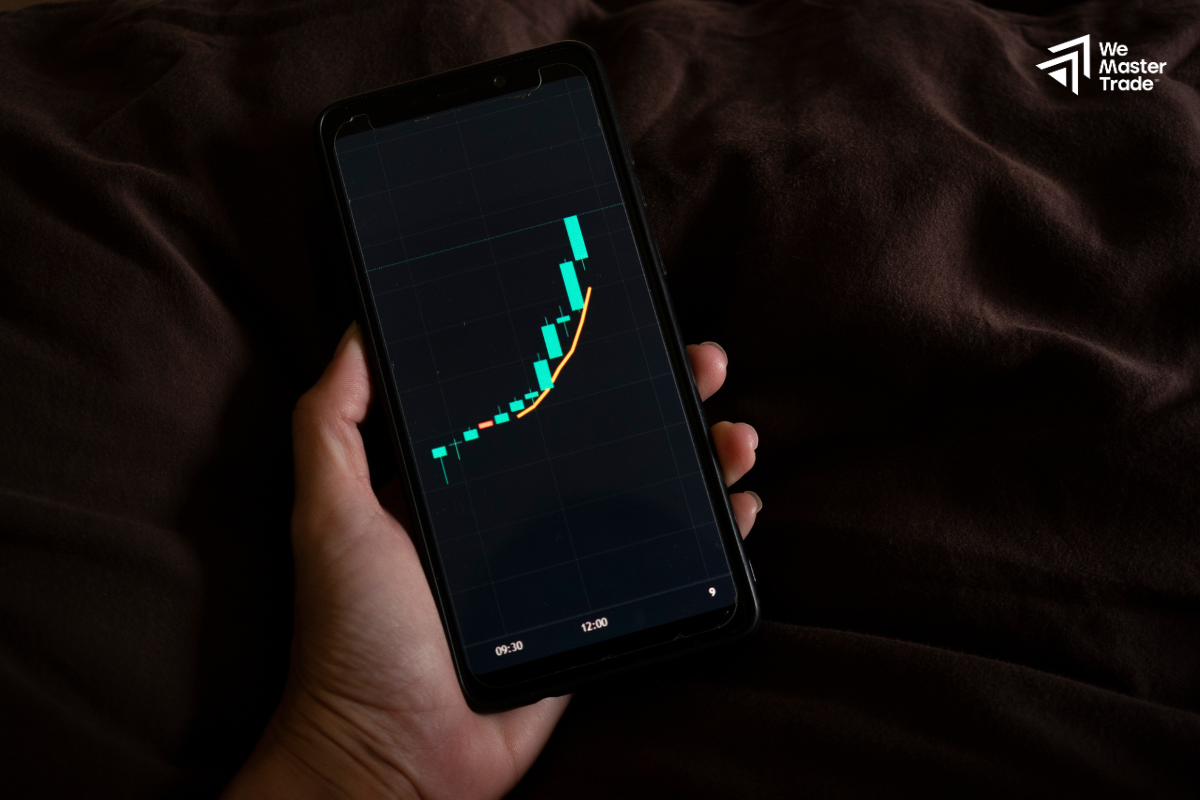
When you’re looking at candlestick charts, which are just a way to see how prices have moved, certain shapes or patterns are really important. Think of them like clues—a hammer, an engulfing bar, or morning or evening stars strongly hint that the market is about to change direction or continue in the same direction. These patterns show a shift in how buyers and sellers are feeling about the price of something.
Additionally, these candlestick patterns become especially powerful when they show up at key price levels—places where the price has often stopped, reversed, or struggled in the past. They are typically known as support (a price floor) or resistance (a price ceiling).
Market Structure Breaks
When you’re looking at how prices are moving, sometimes you see a pattern where the price goes up to a new high, but then drops below a previous low. Sometimes it could also be the opposite: a new low, then a rise above a previous high. This kind of shift is called a break of structure. A big signal that suggests that a current trend might be ending and a new one is about to begin. For traders, this is an exciting time because it typically happens right before a big price move. Catching these moments early means getting into a trade at a really good time and could potentially lead to profitable opportunities.
FAQs
What are “supply zones” and “demand zones”?
Supply and Demand Trading zones are price areas on a chart where sellers historically entered the market in large numbers. It causes the price to reverse downwards. On the other hand, demand zones are price areas where buyers historically entered, causing prices to reverse upwards.
Do I buy in a supply zone or a demand zone?
Traders generally buy in a demand zone, because this is where buying pressure has historically overcome selling pressure. It typically suggests the potential for price to rise. Meanwhile, traders would look to sell or take profits in a supply zone.
Is supply and demand trading risky?
Like all trading, supply and demand trading carries risk. While it gives traders a framework for analysis, prices can always rise and fall unexpectedly. Hence, proper risk management, including stop-loss orders, is essential.
Start Supply and Demand Trading with WeMasterTrade
Master supply and demand without risking your own capital. Combine these expert tips with expert help from WeMasterTrade to start earning more. Contact us today to start your trading journey!





