












Managing risk is as important in the realm of investments as optimizing rewards. If the related risks are too severe or improperly controlled, not all great returns indicate wise investments. Risk-adjusted measures are common tools used by financial analysts and investors to assess performance in view of risk. Among the most often used ratios are the Treynor and Sharpe ratios. Although both measures provide information on risk-adjusted returns, their methods and fit for certain investment situations vary.
The Sharpe Ratio and the Treynor Ratio are discussed in this article along with their main variations and how to decide which would be most appropriate for your investing plan.
Overview of the Treynor Ratio
A portfolio analysis tool called the Treynor ratio lets investors find out how efficiently a portfolio rewards them for assuming systematic risk—that is, market risk. A portfolio’s Treynor ratio tells an investor’s expected return per unit of market risk. It helps one understand how well a portfolio manager strikes a mix between risk and return and might be used to evaluate funds or portfolios with different risk profiles.
Named after American economist Jack Treynor, this ratio is obtained by dividing the excess return over the risk-free rate by the beta of a portfolio. A high Treynor ratio suggests that, considering its degree of risk, the portfolio is generating excellent returns; a low ratio may suggest underperformance in terms of market volatility.
The Treynor Ratio is calculated as:
Treynor Ratio= (Portfolio Return−Risk-Free Rate)/Portfolio Beta
Where:
- Portfolio return: The entire return on the portfolio.
- Risk-Free rate: The return on a risk-free asset, such as government bonds.
- Portfolio beta: A measure of the portfolio’s susceptibility to market swings.
Consider a portfolio with a 9% annual return, 3% risk-free rate, and a beta of 1.2. The Treynor ratio will be determined as follows: Treynor ratio = (9 – 3)/1.2 = 0.5. This means the portfolio is generating 0.5 points in excess return.
Strengths of the Treynor Ratio
- Focus on systematic risk: For already diversified portfolios, unsystematic risks are expected to be negligible and so evaluation is optimal.
- Measures market efficiency: Analyzing returns relative to beta helps one to measure the degree of market efficiency in which an investment reduces market-related risks.
Limitations of the Treynor Ratio
- Requires accurate beta: The accuracy of the Treynor Ratio relies on exact beta readings, which vary depending on computation techniques and periods.
- Limited to diversified portfolios: Restricted to diverse portfolios: It is less helpful for portfolios with notable unsystematic hazards.
Overview of the Sharpe Ratio
Honed after Nobel-winning economist William F. Sharpe, the Sharpe ratio also measures performance in accordance with risk. Using standard deviation, it determines the extent of fluctuation in the rate of return of an asset from its historical average. While the Treynor ratio employs beta and concentrates only on systematic risk, this ratio incorporates both systematic and unsystematic risk.
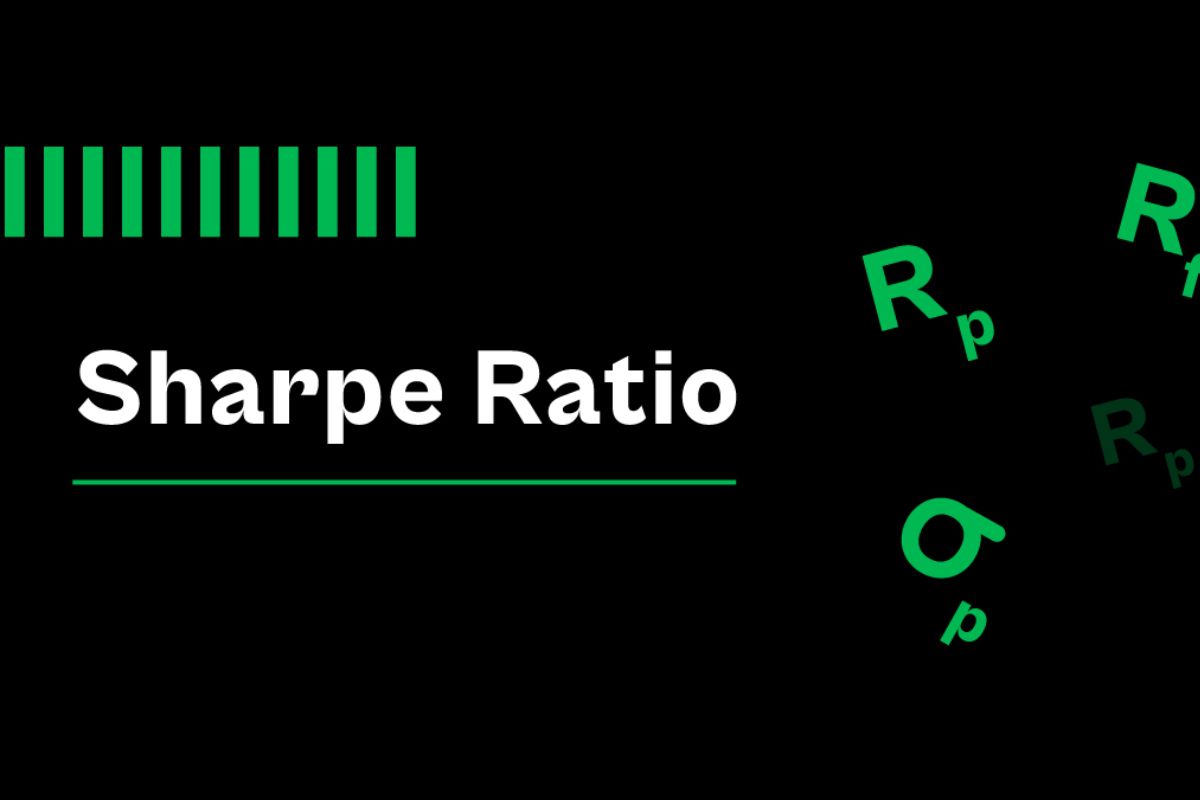
The Sharpe Ratio is calculated as:
Sharpe Ratio= (Portfolio Return−Risk−Free Rate)/Standard Deviation of Portfolio Returns
Where:
- Portfolio return: The overall return achieved by the portfolio over a specified time period.
- Risk-Free rate: The minimal return anticipated from a risk-free asset, such as government bonds.
- The standard deviation of portfolio returns: The measure of the portfolio’s overall risk that captures the variability or volatility of returns across time.
Consider an investor with a portfolio with an annual return of 8% and a risk-free rate of 2% to see how the Sharpe ratio may be used. Standard deviation of the portfolio indicates its volatility; it is 10%. The Sharpe ratio would be computed as (8 – 2) / 10 = 0.6.
Consequently, the investor is receiving 0.6 units of extra return for every unit of risk taken, thereby enabling them to evaluate if the return of the portfolio justifies the degree of volatility.
Strengths of the Sharpe Ratio
- Simple computation: Most portfolios may easily get standard deviation, which the Sharpe Ratio makes use of.
- Considers total risk: It fits less-diverse portfolios as it considers both systematic, market-related, and unsystematic, particular risks.
- Universal application: Relevant to either individual stocks, mutual funds, or whole portfolios
Limitations of the Sharpe Ratio
- Does not distinguish risk types: Focusing on overall risk does not help one differentiate particular risk from market risk.
- Affected by non-normal returns: The ratio makes assumptions about normal distribution of returns, which may not be accurate under actual conditions.
Key Differences Between Sharpe Ratio vs Treynor Ratio

Although the Sharpe Ratio and Treynor Ratio have diverse applications depending on the scenario even if they are good tools for evaluating risk-adjusted performance. Knowing these differences helps investors to optimize their investing strategies and choose the suitable indicator of portfolio success.
Target Audience
- The Sharpe Ratio is better suited to individual investors or portfolio managers with various degrees of diversification. It offers a comprehensive perspective of risk-adjusted returns, making it suited for portfolios that are less diverse.
- The Treynor Ratio is intended for professional investors or those who manage well-diversified portfolios. It focuses on systemic risk, which is the main issue with such portfolios.
The Type of Risk Considered
- The Sharpe Ratio considers overall risk, including both systematic (market-wide) and unsystematic (unique to particular assets) hazards. This makes it a useful indicator for analyzing portfolios with concentrated holdings.
- The Treynor Ratio solely considers systematic risk (as defined by beta) and excludes unsystematic hazards. This concentration makes it especially important for portfolios that are already diverse.
Calculation Inputs

- The Sharpe Ratio employs standard deviation to assess the volatility of a portfolio’s returns over time. It provides a more comprehensive view of risk by taking into account total variability.
- The Treynor Ratio is based on beta, which assesses a portfolio’s vulnerability to market changes. This input indicates the portfolio’s performance in relation to market risks.
Use Case Scenarios
- The Sharpe Ratio is helpful for evaluating portfolios or individual assets with different degrees of risk and variety. It helps investors decide if more risk is justified by bigger benefits.
- The Treynor Ratio fits most for analyzing low unsystematic risk diversified portfolios. It is particularly useful for comparing portfolios with comparable exposure to market movements.
Practical Applications
Using Sharpe Ratio: Consider a person investing on a concentrated portfolio of technology companies. Both systematic risks (market-wide volatility) and unsystematic risks (sector-specific concerns) abound in these equities. In this case, the Sharpe Ratio is perfect as it offers a whole perspective of risk-adjusted performance by considering the whole risk of the portfolio.
Using Treynor Ratio: Imagine now a fund manager supervising an ETF reflecting a wide market index. Already diverse, this portfolio reduces unsystematic risk. with this situation, the Treynor Ratio is a superior instrument as it gauges the returns of the portfolio with respect to its sensitivity to market fluctuations.
Advice for Investors on Selecting and Applying Risk- Adjusted Metrics

- While the Treynor Ratio performs better for portfolios focused on systematic risk, the Sharpe Ratio is superior for less-diverse portfolios.
- Analyze overall volatility using the Sharpe Ratio; measure market-related efficiency using the Treynor Ratio.
- Combining ratios offers a more complete picture of the risk-adjusted performance of a portfolio.
- Regular recalculation of these indicators guarantees your remaining current with evolving market circumstances.
- For a complete investing research, always match these ratios with other financial instruments.
- Learn and practice how to use finance tools through copy trading at WeCopyTrade platform.
Conclusion
The selection between the Sharpe Ratio and Treynor Ratio speaks to the essence of financial decision-making rather than just mathematical inclination. These instruments provide a better view of the risk involved and enable investors to assess performance outside of just raw returns. You may make judgments anchored in both clarity and confidence by choosing the statistic that most fits the structure of the portfolio and the objectives of the investor. Effective investment is about the risks you take to get the rewards, not just about those profits. Learn all about investment’s knowledge and resigter our program at: https://wemastertrade.com/





