














The Moving Average Convergence Divergence or MACD trading strategy is popular among traders. This approach leverages the MACD indicator on charts to identify possible opportunities in the market. The MACD helps traders predict when an asset’s price will rise or decrease. For novices, using a MACD method might be a straightforward approach to look for entry and exit points in their trades. This article will give a basic overview of how the MACD works and how it can help new investors.
What is the MACD Trading Strategy?
The MACD trading strategy utilizes the Moving Average Convergence Divergence, also called MACD, indicator. This special charting tool was created to spot shifts in the strength of a stock’s price momentum over time. It does this by comparing a security’s moving averages to identify if it is speeding up or slowing down.
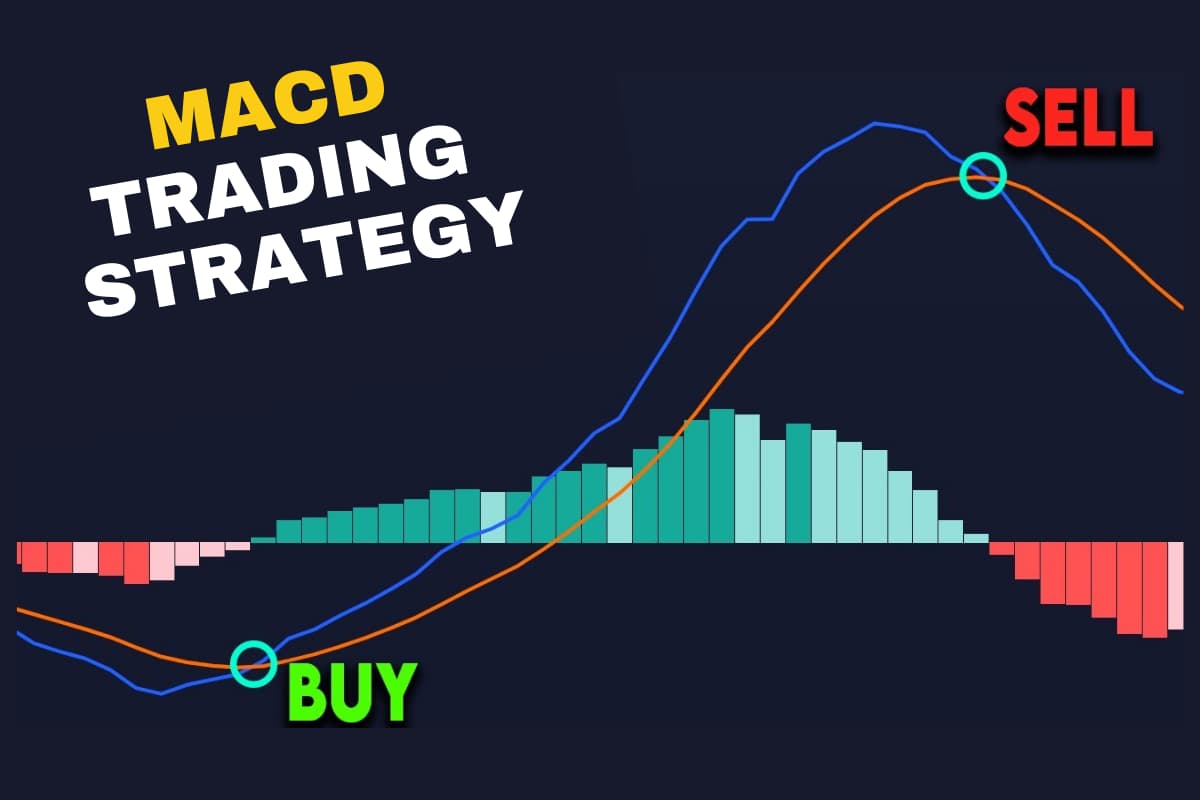
When the lines on the MACD shift directions, it usually signals that upward or downward movement may soon follow. Traders following the MACD strategy watch for these crosses – where one line cuts through the other – to find possibly good times for buys or sells.
By paying attention to the MACD and any related signals it generates, beginners have an approach they can use to potentially spot successful trading opportunities in the market.
How Does MACD Work?
The MACD indicator provides signals to traders by comparing moving averages in a special way. It is made up of three key features:
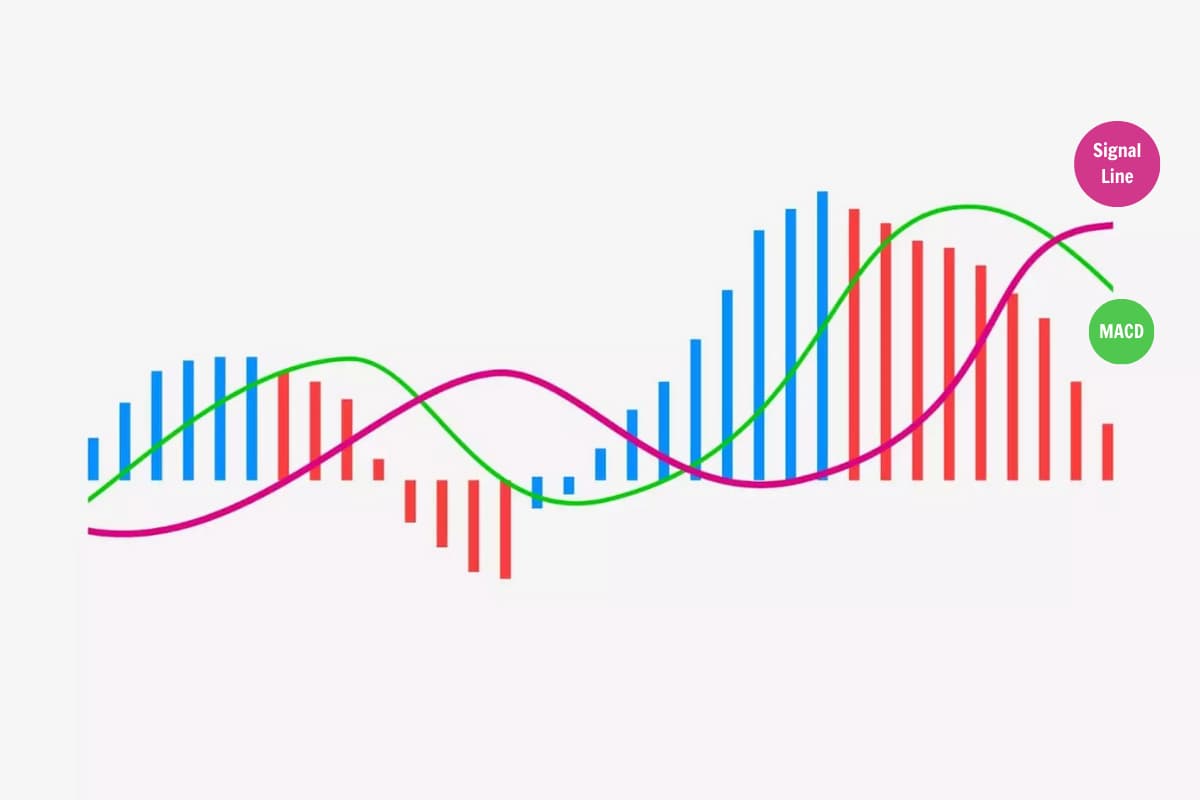
- MACD line: This line shows the difference between a stock’s price averages over two different periods, usually 12 and 26 days. This helps spot if the price is increasing or decreasing faster recently.
- Signal line: A slower moving average of the MACD line itself that follows the overall trend. It helps confirm real shifts in the strength of the trend.
- Histogram: A chart beneath the MACD line that displays the distance between the line and the signal line. It acts like a gauge showing how strong the momentum is.
When these parts move in certain directions together, like the MACD line cutting through the signal line, it indicates the investment may be speeding up or slowing down. Traders can watch for these moves to find potential timing signals for making trades according to whether the trend seems up or down.
How to Utilize the MACD Trading Strategy
Utilizing the MACD is simple once you understand the signals. Here we look at the most common signals:
MACD Line Crossing Above the Signal Line – Buy Signal
The MACD trading strategy watches for when the MACD line moves higher than the signal line. This crossover signifies that the quicker moving average has surpassed the slower one. Traders interpret this as a potential sign that the asset’s worth may be ready to increase again after declining.
The line crossing above presents a chance to purchase as the momentum seems to have turned bullish according to how the MACD reads the market.
MACD Line Crossing Below the Signal Line – Sell Signal
The MACD trading strategy considers it a sign to possibly sell when the MACD line falls below the signal line. This crossover is viewed as potentially indicating that the asset’s value may begin declining after rising.
Traders see this bearish line crossing below as an opportunity to sell existing holdings or avoid new buys.
Histogram Growing – Trend strengthening
The MACD trading strategy also watches the histogram. When the bars in the histogram become bigger below or above the center line, it can mean the upward or downward movement is picking up steam.
- Larger green bars signal rising prices may continue;
- Bigger red bars may hint the trend is losing strength.
Technical Indicators that Work With MACD

The MACD indicator may be made more valuable by combining it with other common charting tools. Traders have found the following indicators to be helpful to use alongside MACD:
- Relative Strength Index (RSI): The RSI shows if the asset’s price has risen or fallen more than usual recently. This helps determine if it may be due for a change.
- Moving averages: Moving averages create smooth lines that highlight typical high and low price levels, known as support and resistance.
- Bollinger bands: Bollinger Bands display spread lines that can signal when a big switch from rising to falling or vice versa may happen soon.
- Fibonacci retracements: These lines drawn from price peaks to valleys estimate where the cost is most likely to pause on its way back up or down.
Using two or more indicators together gives traders more confidence that what they see on the charts reflects what could take place next in the market’s price movements.
Timeframe Selection
It is vital to choose the right timeframe when using technical indicators like MACD. The timeframe refers to how long each period is on the price chart, such as minutes, days, or weeks. Traders need to consider different timeframes:
- Shorter timeframes, like 15 minutes or 1 hour, show more frequent price movements. This could lead to more trading signals but also “false alarms” from tiny price fluctuations.
- Longer timeframes, like 1 day or 1 week, smooth out shorter waves in the market. These timeframes tend to give fewer signals, but the signals may be more dependable since they ignore brief price changes.
It is generally a great idea to check different timeframes together to get a fuller picture of where the asset’s value is heading in both the near and far future. Traders should pick timeframes that best match their goals, preferred trading approach, and risk tolerance.
Stop-Loss and Take-Profit
Stop-loss and take-profit orders
Traders using the MACD strategy can set stop-loss and take-profit orders to help manage their trades.
- Stop-loss orders allow them to set the level of losses they are willing to accept
- Take-profit orders let them set a target price to sell at a profit.
Although stop orders may not always trigger at the exact price due to fast market moves, these triggers aim to help cut losses or lock in gains.
In addition, traders should note that without guaranteed stop-loss orders, which require payment, slippage could still cause stops to be filled at worse levels during spikes in volatility.
Why Traders Love the MACD Trading Strategy
Many traders are fans of the MACD approach because:
- Works across markets: It can work well for different types of financial markets, such as stocks, foreign currency, or cryptocurrencies.
- Simple to learn: The MACD makes it easy for beginners to grasp the basic concept with practice.
- Provides clear signals: Clear signals from line crosses and histogram changes help traders identify opportunities to buy and sell without as much uncertainty. This makes following the MACD strategy popular.
Conclusion
In conclusion, the MACD trading strategy gives a straightforward way for novices to identify potential buying and selling opportunities in the market. By understanding when the MACD line crosses above or below the signal line, or observing the histogram for signs of momentum, novices can gain clarity on timing their trades. Adding stop-loss and take-profit orders allows MACD users to aim to manage risks.
Overall, this approach offers a clear and versatile method that many traders find useful for entering and exiting the markets. For additional tips, please visit https://wemastertrade.com/blog/.





