


For much of the success of an investment portfolio, the Treynor Ratio controls. It enables investors to assess the performance of their portfolio in relation to the current state of the market risk. Using this ratio will help investors determine if their pay for the risk they are taking in respect to the market is reasonable. This article will provide a thorough tutorial on computing the Treynor Ratio, thus helping you to make better informed decisions and maybe improve the performance of your portfolio if you are an investor trying to know how to compute this ratio to maximize your investment plan.
Overview of Treynor Ratio
Jack Treynor created the Treynor Ratio, often referred to as the Treynor Index, in the 1960s as a means of gauging a portfolio’s relative performance to its systemic risk. The formula contrasts the portfolio’s excess return above the risk-free rate with its beta—a gauge of market risk. The portfolio’s return relative to risk is better the higher the Treynor Ratio.
Why does the Treynor Ratio matter?
The Treynor Ratio lets investors assess, in relation to the whole market, how well their portfolio is paying them for the risk they are assuming. The Treynor Ratio is especially helpful for investors who want to evaluate how their portfolio performs in respect to market volatility as it concentrates solely on systematic risk while other ratios such as the Sharpe Ratio take overall risk into account. You can learn more about ratios and how to apply them in practice through copy trading at WeCopyTrade platform.
Key Concept: Beta
Understanding beta will help one to compute the Treynor Ratio. Beta gauges the general market movement sensitivity of the portfolio. A beta less than 1 denotes a less volatile portfolio; a beta larger than 1 indicates that the portfolio is more volatile than the market. Since it shows the degree of risk connected with the portfolio in relation to the market, beta is a fundamental part of the Treynor Ratio.
Pros of the Treynor Ratio
- Emphasize systematic risk: Since the Treynor Ratio only considers systematic risk—market risk—it is a more accurate instrument for assessing a portfolio’s performance with respect to changes in the market. For well-diversified portfolios with low unsystematic risk especially this is helpful.
- Easy to compare portfolios: Simple comparisons across many portfolios with differing degrees of market exposure are made possible by the Treynor Ratio. It enables investors to find which portfolio provides the highest return for their degree of systematic risk as it standardizes performance depending on beta.
- Useful for risk-adjusted returns: Investors looking for risk-adjusted returns may depend on the Treynor Ratio to determine if they are being fairly paid for assuming market risk. Making a suitable investment plan depends on this.
Cons of the Treynor Ratio
- Requires accurate beta: The accuracy of the Treynor Ratio mostly relies on the precise beta computation. Should the beta be misjudged, the ratio may be distorted and erroneous investment judgments result. Beta may also vary with time, therefore influencing the ratio’s dependability.
- Restricted to systematic risk: Although the Treynor Ratio is very good for evaluating market risk, it ignores unsystematic risk—that particular to individual assets. This makes it less appropriate for assessing portfolios either not well-diverse or with concentrated holdings.
- Assumes a linear relationship: Though it may not always represent actual market behavior, the Treynor Ratio assumes a linear connection between risk and return. Changes in beta and the dynamic character of markets might produce variations that compromise the dependability of the ratio.
The Treynor Ratio Formula
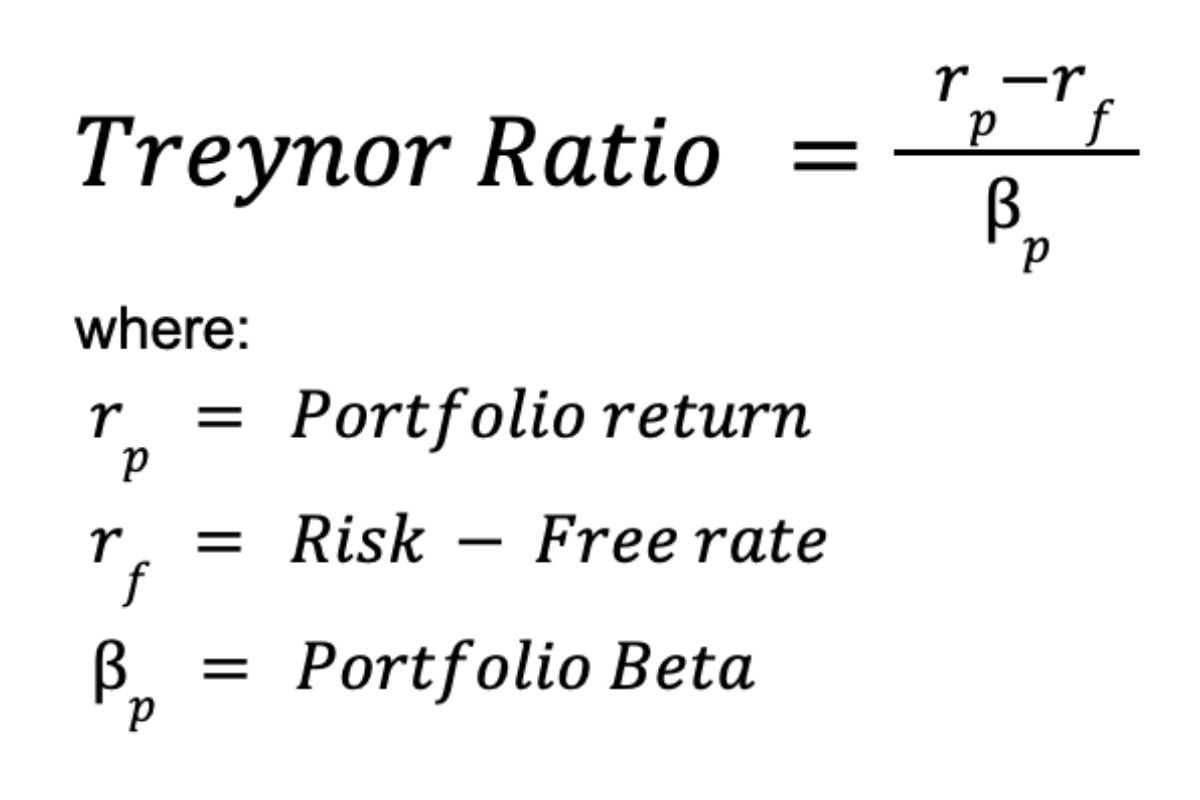
The Treynor Ratio is calculated using the following formula:
Treynor Ratio=(Rp−Rf)/βp
Where:
- Rp = Return of the portfolio
- Rf = Risk-free rate (usually the return on government bonds)
- βp = Beta of the portfolio
Explanation of the Formula Components:
- Return of the portfolio (Rp): Comprising capital gains, dividends, and interest income, this represents the portfolio’s whole return.
- Risk-free rate (Rf): The return an investor may get from an investment with zero risk, say government bonds, is known as the risk-free rate.
- Beta of the portfolio (βp): Beta gauges the market’s movement sensitivity of the portfolio. A larger beta indicates that the portfolio is more market movement sensitive.
How to Calculate Treynor Ratio
This article will bring you through every stage of computing the Treynor Ratio, a fundamental statistic assessing the risk-adjusted return of an investment portfolio. Understanding and using the Treynor Ratio will enable you to evaluate the performance of your portfolio in respect to the market risk it is subject to, therefore guiding your investment selections.
Step 1: Determine the Portfolio’s Return

The first step in calculating the Treynor Ratio is to find the return of the portfolio (Rp). This is usually expressed as a percentage over a certain period (annually, quarterly, monthly).
How to Calculate the Portfolio’s Return:
- Calculate the ending value of the portfolio: Add up the current value of all the assets in the portfolio (stocks, bonds, cash equivalents, etc.).
- Determine the starting value of the portfolio: This is the value of the portfolio at the beginning of the period.
- Use the formula for return: Rp= [(Ending Value−Starting Value)/Starting Value]×100
This yields, expressed as a percentage, the overall return during the time.
For instance, the return would be: $100,000 if your portfolio began the year with $110,000.
Rp=[(110,000−100,000)/100,000] ×100=10%
Step 2: Identify the Risk-Free Rate
Usually the return on a government bond or another low-risk investment, the next step is to determine the risk-free rate ( Rf). Typical sources of the risk-free rate:
- U.S. treasury bonds: Often used as a benchmark for the risk-free rate, especially the 10-year Treasury bond.
- Other government bonds: Your nation will determine the corresponding government bond rates to be applicable.
Usually changing with time, the risk-free rate should be taken into account throughout the same period as the return of your portfolio.
Example: If the current yield on a 10-year United States Treasury bond is 3%, the risk-free rate is also 3%.
Step 3: Determine the portfolio’s beta

Next, calculate the portfolio’s beta (β p). Beta is a measure of how much the portfolio’s returns vary in comparison to the market’s returns. You may get the beta of each stock in the portfolio and then compute a weighted average depending on the percentage of each asset in the portfolio.
To calculate beta, follow these steps:
- Determine the beta of each assets: The beta of specific stocks or assets may be found on financial websites or databases like as Bloomberg, Yahoo Finance, and Reuters.
- Calculate the weighted average beta: The weighted average beta is computed by multiplying the beta of each asset by its share in the portfolio and adding the results.
? ? =∑(wi×βi)
Where:
- The weight of the i-th asset in the portfolio, denoted by ??, is based on its value.
- The beta of the i-th asset is denoted by ?? β.
Example: If you have two stocks in your portfolio: Stock A with a beta of 1.2, making up 60% of your portfolio, and Stock B with a beta of 0.8, making up 40%, the portfolio’s beta will be:
β p=(0.6×1.2)+(0.4×0.8)=0.72+0.32=1.04
Step 4: Apply the Formula to Calculate the Treynor Ratio
Now that you have all of the components (portfolio return, risk-free rate, and beta), you can plug them into the Treynor Ratio formula:
Example Calculation:
- Portfolio return (Rp) = 10%
- Risk-free rate (Rf) = 3%
- Beta (βp) = 1.04
Treynor Ratio=(10%−3%)/1.04 ≈6.73%
Conclusion
Knowing and using the Treynor Ratio helps investors to assess the risk-adjusted return of their portfolios, therefore enabling more smart choices. Especially helpful for evaluating diversified portfolios as a tool emphasizing systemic risk is It is crucial to keep in mind, nevertheless, that the ratio relies on a precise estimate of beta and could not entirely reflect the risks connected with certain assets. Investors may make good use of the Treynor Ratio by carefully weighing its benefits and drawbacks to improve the performance of their portfolio in line with their financial goals. Check out more helpful trading tips and resigter our program at: https://wemastertrade.com/

