












The foreign exchange market, known as Forex, represents the largest financial market globally, with daily trading volumes exceeding $7.5 trillion as of 2026. This immense liquidity and constant price fluctuation present both significant opportunities and complex challenges for traders worldwide. Navigating this dynamic environment effectively requires robust tools and a deep understanding of market behavior.
At the heart of successful forex trading lies the ability to interpret market data visually. This is precisely where forex charts become indispensable. They offer a graphical representation of price movements over time, serving as the primary instrument for technical analysis forex. By translating raw data into discernible patterns and trends, these charts empower traders to make informed decisions, identify potential entry and exit points, and manage risk more effectively.
This comprehensive guide will walk you through the various types of forex charts, teach you how to read forex charts, and explore essential chart patterns and technical indicators. By the end, you will possess a foundational understanding necessary to perform insightful forex chart analysis and begin to master forex charts for your trading endeavors, ultimately enhancing your strategic approach to the market.
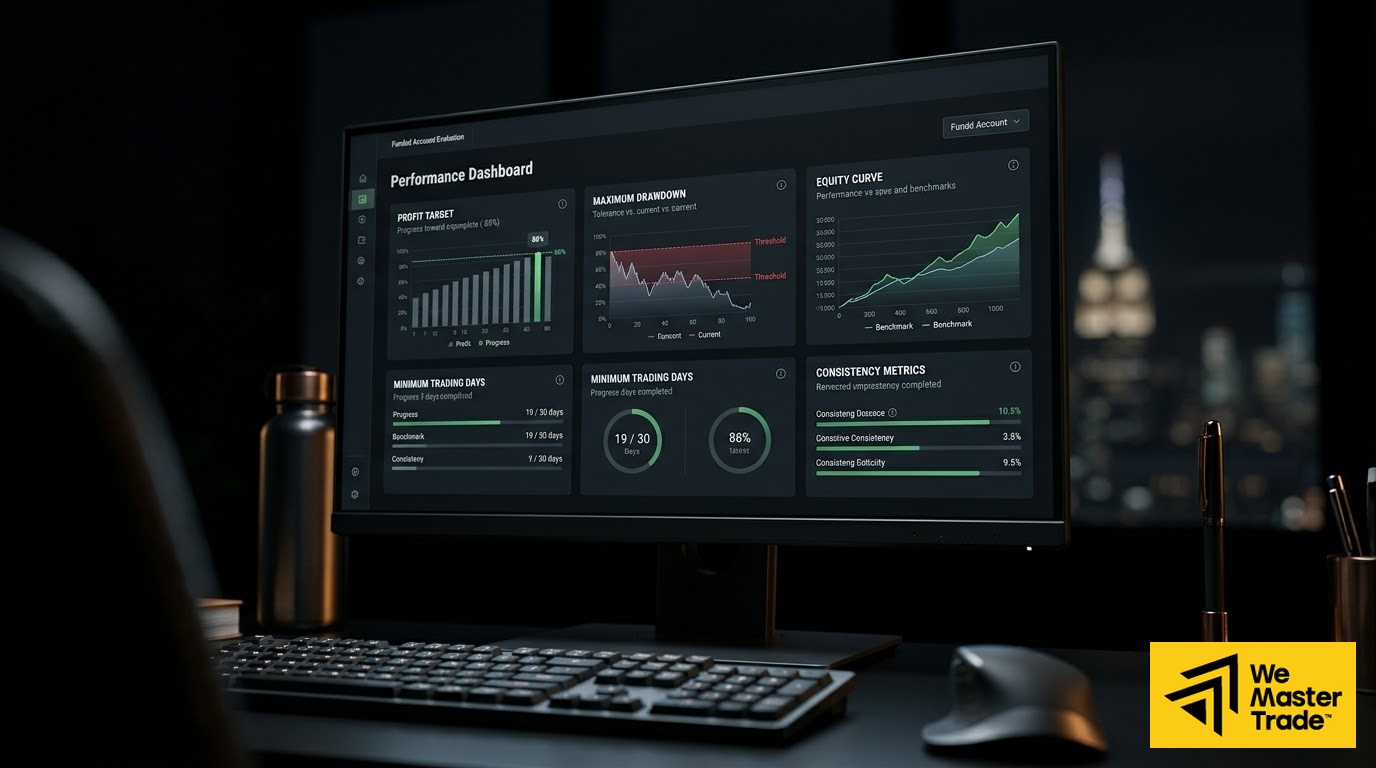
1. What Are Forex Charts & Why Are They Essential for Traders?
Forex charts are graphical representations of currency pair price movements over specific periods. They translate complex market data, including open, high, low, and close prices, into an easily digestible visual format. This visual data is the cornerstone of technical analysis, a methodology used by traders to evaluate investments and identify trading opportunities by analyzing statistical trends gathered from trading activity, such as price movement and volume. Without these charts, understanding the intricate dance of supply and demand in the Forex market would be virtually impossible.
The primary purpose of forex charts is to provide a historical record of price action, allowing traders to observe past market behavior and project potential future movements. By identifying recurring patterns, trends, and key support and resistance levels, traders can develop and refine their trading strategies. A reliable charting platform is paramount for any serious trader. Traders seeking robust functionality will benefit from exploring our prop trading platform.
Furthermore, charts facilitate the identification of market sentiment. The shape, size, and color of chart elements, particularly in candlestick charts forex, can convey whether buyers or sellers are in control, the intensity of their conviction, and potential exhaustion points. For those ready to capitalize on market movements, instant trading access can be a significant advantage. This immediate insight into market psychology helps traders anticipate shifts and react proactively rather than reactively.
Effective understanding forex charts is a continuous learning process. New and experienced traders alike can deepen their understanding through our trading platform. The ability to quickly interpret real time forex charts allows for swift decision-making in a market that never sleeps. Ultimately, the goal is successful trading and secure profit withdrawals. As traders grow, the ability to scale up your trading becomes vital for maximizing potential gains and managing larger capital effectively.
2. Deciphering the Visual Language: Types of Forex Charts
The visual language of forex charts comes in several forms, each offering a distinct perspective on market data. Understanding these types of forex charts is crucial for selecting the one that best aligns with your trading style and analytical needs. While all charts display price over time, they differ in the level of detail provided and how that information is presented.
Line Charts: The Simplest View
Line charts are the most basic form of forex charts, connecting a series of closing prices over a specified timeframe. They offer a clear, uncluttered view of the overall trend, making it easy to spot major shifts in market direction. Because they only focus on closing prices, line charts tend to smooth out market noise, providing a high-level overview. They are particularly useful for long-term trend identification and comparing the performance of multiple currency pairs, but they lack the granular detail needed for precise entry and exit points.
Bar Charts: Open, High, Low, Close at a Glance
Bar charts provide more detail than line charts by displaying four key pieces of information for each period: the open, high, low, and close price. Each vertical bar represents a specific timeframe (e.g., one hour, one day). The top of the bar indicates the highest price reached, while the bottom shows the lowest. A small horizontal tick on the left side of the bar denotes the opening price, and a similar tick on the right marks the closing price. This comprehensive data allows for a more nuanced forex chart analysis, revealing the range of price movement and the relationship between opening and closing prices within each period.
Candlestick Charts: The Professional’s Choice
Candlestick charts forex are predominantly favored by professional traders due to their rich visual information and intuitive representation of price action. Originating in 18th-century Japan, each “candlestick” provides the same four data points as a bar chart (open, high, low, close) but in a more visually compelling format. The “body” of the candlestick represents the range between the opening and closing prices. If the close is higher than the open, the body is typically green or white (bullish); if the close is lower than the open, it’s usually red or black (bearish). The “wicks” or “shadows” extending from the top and bottom of the body indicate the high and low prices reached during that period. This visual richness allows traders to quickly gauge market sentiment, volatility, and potential turning points, making them a powerful tool for developing forex trading strategies.

3. Mastering Technical Analysis: Key Chart Patterns and Structures
Beyond individual candlesticks, prices on forex charts tend to form recognizable geometric shapes and sequences known as forex chart patterns. These patterns are the bedrock of technical analysis forex, offering predictive insights into future price movements. Identifying and understanding these structures can significantly enhance a trader’s ability to anticipate reversals or continuations of existing trends. Effective forex chart analysis relies heavily on recognizing these patterns in real-time.
Reversal Patterns: Signaling a Shift
Reversal patterns indicate that an existing trend is likely to change direction. One of the most famous is the Head and Shoulders pattern, which suggests a bullish trend is about to reverse into a bearish one (and its inverse for a bearish-to-bullish reversal). This pattern consists of three peaks, with the middle peak (the head) being the highest, flanked by two lower peaks (the shoulders). Other key reversal patterns include Double Tops and Double Bottoms, which indicate that price has attempted to break a certain level twice and failed, signaling a potential reversal. Triple Tops and Triple Bottoms are similar but involve three attempts. Recognizing these patterns near significant support and resistance forex levels can provide strong signals for potential trend changes.
Continuation Patterns: Trends in Motion
Continuation patterns, conversely, suggest that a temporary pause in price movement will likely be followed by a continuation of the prevailing trend. These patterns represent periods of consolidation where the market takes a “breather” before resuming its original direction. Examples include Flags and Pennants, which are short-term, small patterns that form against the trend and typically resolve with a strong move in the direction of the original trend. Wedges can also act as continuation patterns, particularly when they slope in the same direction as the trend. Identifying these patterns allows traders to enter or add to positions after a brief consolidation, capitalizing on the established momentum.
Indecision Patterns: Market Equilibrium
Some patterns indicate periods of market indecision or equilibrium, where neither buyers nor sellers are firmly in control. Triangle patterns (symmetrical, ascending, and descending) are common examples. Symmetrical triangles represent a period of narrowing price range, indicating a balance between buyers and sellers, often preceding a strong breakout in either direction. Ascending triangles, characterized by a flat top and rising lows, suggest bullish pressure, while descending triangles, with a flat bottom and falling highs, indicate bearish pressure. Understanding these patterns helps traders prepare for potential breakouts and adjust their price action trading strategies accordingly.
4. The Power of Timeframes: Short-Term vs. Long-Term Analysis
The concept of forex chart timeframes is fundamental to effective forex chart analysis. A timeframe refers to the period that each individual bar or candlestick on a chart represents. Options range from very short durations, such as 1-minute or 5-minute charts, to much longer ones like daily, weekly, or even monthly charts. The choice of timeframe dramatically influences the perspective a trader gains on market behavior and directly impacts the viability of different forex trading strategies.
Short-term timeframes (e.g., 1-minute, 5-minute, 15-minute) provide a granular view of price action, capturing every small fluctuation. These are essential for scalpers and day traders who aim to profit from rapid, fleeting price movements. Analyzing real time forex charts on these shorter timeframes allows for quick entries and exits, but also exposes traders to significant market noise and whipsaws. The fast pace requires constant attention and quick decision-making, often involving numerous trades within a single trading session.
Medium-term timeframes (e.g., 1-hour, 4-hour, Daily charts) are favored by swing traders and position traders. These timeframes filter out much of the short-term noise, revealing more sustained trends and larger price swings. A daily chart, for instance, provides a clear picture of the market’s direction over several days or weeks, making it easier to identify significant support and resistance forex levels and more reliable forex chart patterns. Traders using these timeframes typically hold positions for several hours to several days, focusing on capturing larger moves.
Long-term timeframes (e.g., Weekly, Monthly charts) are primarily used for macroeconomic analysis and identifying overarching trends. These charts are invaluable for long-term investors or traders who want to understand the bigger picture before delving into shorter timeframes. Analyzing forex trading charts on a weekly or monthly basis can help confirm the strength and direction of a major trend, providing crucial context that can prevent traders from making short-term decisions that contradict the broader market direction. Many professional traders use a multi-timeframe analysis approach, combining insights from various timeframes to build a more robust and confident trading plan.
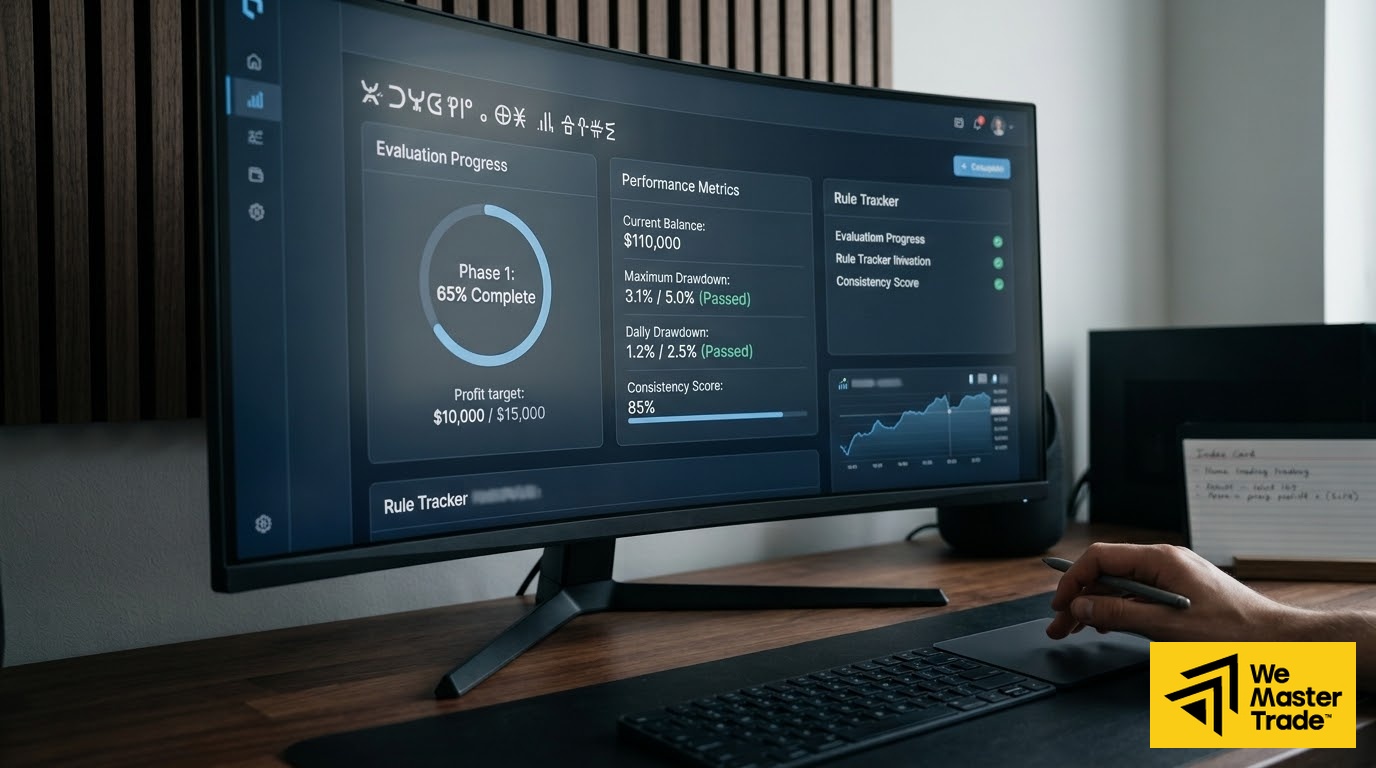
5. Integrating Indicators for Enhanced Forex Chart Analysis
While price action trading using raw charts and patterns is powerful, forex indicators offer an additional layer of analytical depth. These mathematical calculations, based on historical price and/or volume data, are plotted on forex charts to help confirm trends, identify momentum, and signal potential overbought or oversold conditions. Integrating indicators effectively can provide valuable insights, but traders must avoid over-reliance and understand their limitations.
Trend-Following Indicators: Riding the Wave
Trend-following indicators are designed to help traders identify and confirm the direction of a market trend. Moving Averages (MAs), such as the Simple Moving Average (SMA) and Exponential Moving Average (EMA), are among the most popular. They smooth out price data to show the average price over a specific period. Crossovers of different moving averages can signal trend changes, while the slope of an MA indicates the strength and direction of the trend. Another key trend-following indicator is the Moving Average Convergence Divergence (MACD), which uses the relationship between two moving averages to identify momentum and potential trend reversals. When used effectively, these tools provide valuable context for forex chart analysis.
Oscillators: Measuring Momentum and Overbought/Oversold Conditions
Oscillators are indicators that fluctuate between defined high and low values, typically plotted below the main price chart. They are particularly useful for identifying potential market turning points when a trend might be losing momentum or when a market is becoming overbought (prices too high, likely to fall) or oversold (prices too low, likely to rise). The Relative Strength Index (RSI) is a momentum oscillator that measures the speed and change of price movements, typically ranging from 0 to 100. Readings above 70 often suggest overbought conditions, while those below 30 indicate oversold conditions. Similarly, the Stochastic Oscillator compares a closing price to its price range over a given period, also signaling overbought/oversold levels and potential divergences with price.
Volatility Indicators: Gauging Market Movement
Volatility indicators measure the rate of price change, providing insight into how much the price of a currency pair is fluctuating. Bollinger Bands are a common example, consisting of a simple moving average (the middle band) and two outer bands representing standard deviations from that average. When the bands widen, it suggests increased volatility, while narrowing bands indicate decreasing volatility. Price often tends to revert to the middle band, and touches or breaks of the outer bands can signal potential reversals or continuation of strong trends. Using these advanced forex charting techniques helps traders adapt their strategies to current market conditions, whether volatile or calm.

6. Practical Application: Developing Forex Trading Strategies with Charts
The ultimate goal of learning how to read forex charts and perform forex chart analysis is to develop effective forex trading strategies that yield consistent results. Applying theoretical knowledge to practical scenarios involves combining chart patterns, indicators, and sound risk management principles. The choice of strategy often depends on a trader’s personality, available time, and risk tolerance.
Price Action Strategies
Price action trading focuses on interpreting the raw movement of price on forex charts, often with minimal or no indicators. Traders using this approach pay close attention to individual candlestick patterns (e.g., pin bars, engulfing patterns, dojis) and how price interacts with key support and resistance forex levels. For instance, a strong bullish engulfing pattern at a significant support level could signal a buying opportunity. This strategy emphasizes understanding market psychology directly from the chart, making it one of the most direct ways of using forex charts for profit. Mastering price action requires extensive practice in recognizing patterns and understanding their context.
Trend-Following Strategies
Trend-following strategies aim to capitalize on sustained price movements in one direction. Traders identify a clear trend using tools like moving averages or by visually inspecting the slope of price on forex charts. They then seek entry points that align with the trend, often after a minor pullback or consolidation indicated by forex chart patterns like flags or pennants. For example, a trader might enter a long position on an upward-trending currency pair when price pulls back to a rising moving average, confirmed by a bullish candlestick pattern. The objective is to ride the trend for as long as it lasts, exiting when signs of reversal emerge.
Reversal Strategies
Reversal strategies involve identifying when a trend is losing momentum and is likely to change direction. This often involves looking for forex chart patterns such as head and shoulders, double tops, or divergence between price and momentum forex indicators like the RSI. For example, if price makes a new high but the RSI makes a lower high, it could be a bearish divergence signaling an impending reversal. These strategies can be higher risk as they go against the prevailing trend initially but offer the potential for significant rewards if the reversal is correctly identified. Utilizing a professional forex charting tools can significantly enhance the accuracy and speed of identifying such complex setups.
Regardless of the chosen strategy, consistent backtesting and forward testing are crucial. A best forex charting platform will offer robust tools for historical data analysis, allowing traders to refine their strategies before deploying them with real capital. Effective risk management, including setting stop-loss orders and managing position sizes, is paramount to protect capital while aiming for profits.
Key Questions About Forex Charts Answered
Q: What is the primary purpose of using forex charts in trading?
A: Forex charts visually represent historical price data, enabling traders to identify trends, patterns, and potential future price movements through technical analysis. They are essential for understanding market sentiment and making informed trading decisions.
Q: Which type of forex chart is most commonly used by professional traders?
A: Candlestick charts are predominantly favored by professional forex traders due to their rich visual information, displaying open, high, low, and close prices within specific timeframes in an easily interpretable format.
Q: How do timeframes impact forex chart analysis?
A: Timeframes determine the period each chart bar or candlestick represents, allowing traders to analyze market behavior from short-term (e.g., 1-minute) to long-term (e.g., monthly) perspectives for different trading strategies and to conduct multi-timeframe analysis.
Q: Can I use forex charts to predict market reversals?
A: Yes, forex charts, especially through the identification of specific chart patterns (e.g., head and shoulders, double tops/bottoms) and divergence with indicators, can signal potential market reversals, though confirmation is always recommended.
Q: Where can I access reliable, real-time forex charts for free?
A: Reliable real-time forex charts are often available through popular trading platforms like MetaTrader 4/5, cTrader, or dedicated charting services such as TradingView, many offering free basic functionalities for comprehensive analysis.
The WeMasterTrade Advantage: Empowering Traders with Immediate Capital and Advanced Tools
Many skilled traders understand how to read forex charts and perform sophisticated forex chart analysis, yet often face significant barriers to accessing the capital required to truly capitalize on their expertise. Traditional prop firms frequently impose lengthy, often restrictive, evaluation periods that delay a trader’s journey to financial independence and success.
WeMasterTrade’s Angel Funding model directly addresses this challenge by offering instant funded trading accounts without evaluation. Our unique differentiator lies in our dedicated Risk Management team, which copies high-probability trades at up to a 1:4 ratio alongside the trader’s positions. This innovative approach ensures that “WeMasterTrade’s profitability directly depends on trader success,” aligning our goals with yours. This model, recognized with multiple industry awards since 2021, allows traders to focus on their strategies and master forex charts without capital constraints.
With WeMasterTrade, disciplined traders can immediately apply their knowledge of forex charts and intricate trading strategies to real capital, scaling their potential profit up to an impressive 90% split. This removes the evaluation hurdle, letting proven expertise immediately translate into tangible opportunity and growth.
If you are a disciplined trader with a proven understanding of market dynamics and a desire to trade larger capital without the typical barriers, explore how WeMasterTrade can be your partner in achieving your trading ambitions and turning your chart analysis skills into significant returns.





