


Elliott Wave Theory is one of the most well-known ideas in technical analysis. Many traders use it to understand market cycles, price trends, and investor psychology. At first, it may look complicated, but the basic idea is simple: markets often move in waves.Instead of moving straight up or straight down, prices usually move in a pattern of advances and pullbacks. Elliott Wave Theory helps traders study these movements and identify where the market may be in a larger trend.
In this guide, we will explain Elliott Wave Theory in a simple way, including the 5-wave pattern, ABC correction, key rules, Fibonacci relationships, and how traders use it in real trading.
What Is Elliott Wave Theory?
Elliott Wave Theory is a technical analysis method that studies repeating price patterns in financial markets. The theory was developed by Ralph Nelson Elliott in the 1930s. He believed that market prices move in cycles because investor emotions also move in cycles.
When traders are optimistic, prices usually rise. When traders become fearful, prices often fall. These emotional changes create wave patterns on a chart.
Elliott Wave Theory can be used in many markets, including stocks, forex, commodities, indices, and crypto. However, it should not be used alone. It works best when combined with other tools such as technical analysis, support and resistance, trendlines, volume, and risk management.
The Basic Elliott Wave Structure
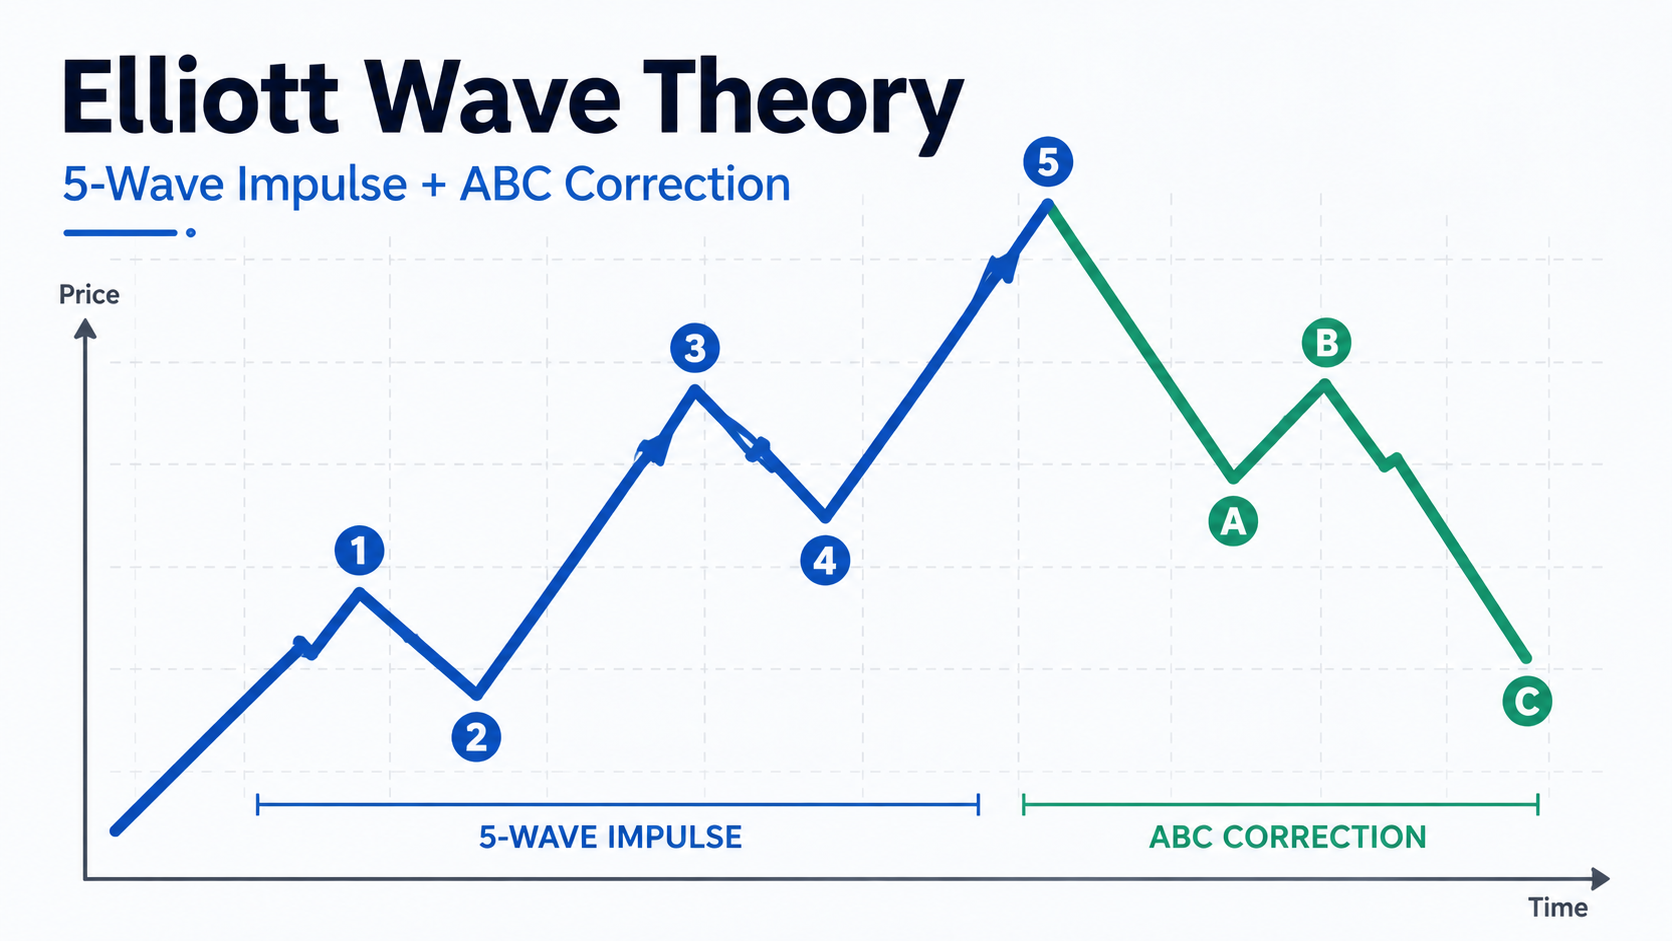
The most common Elliott Wave structure has two main parts:
- 5 impulse waves that move in the direction of the main trend
- 3 corrective waves that move against the main trend
This is often written as a 5-3 wave pattern.
In an uptrend, the price usually moves higher in five waves. After that, the market may correct lower in three waves. In a downtrend, the same idea works in reverse.
The 5 Impulse Waves
The first part of the Elliott Wave pattern is the 5-wave impulse move. These waves move in the direction of the larger trend.
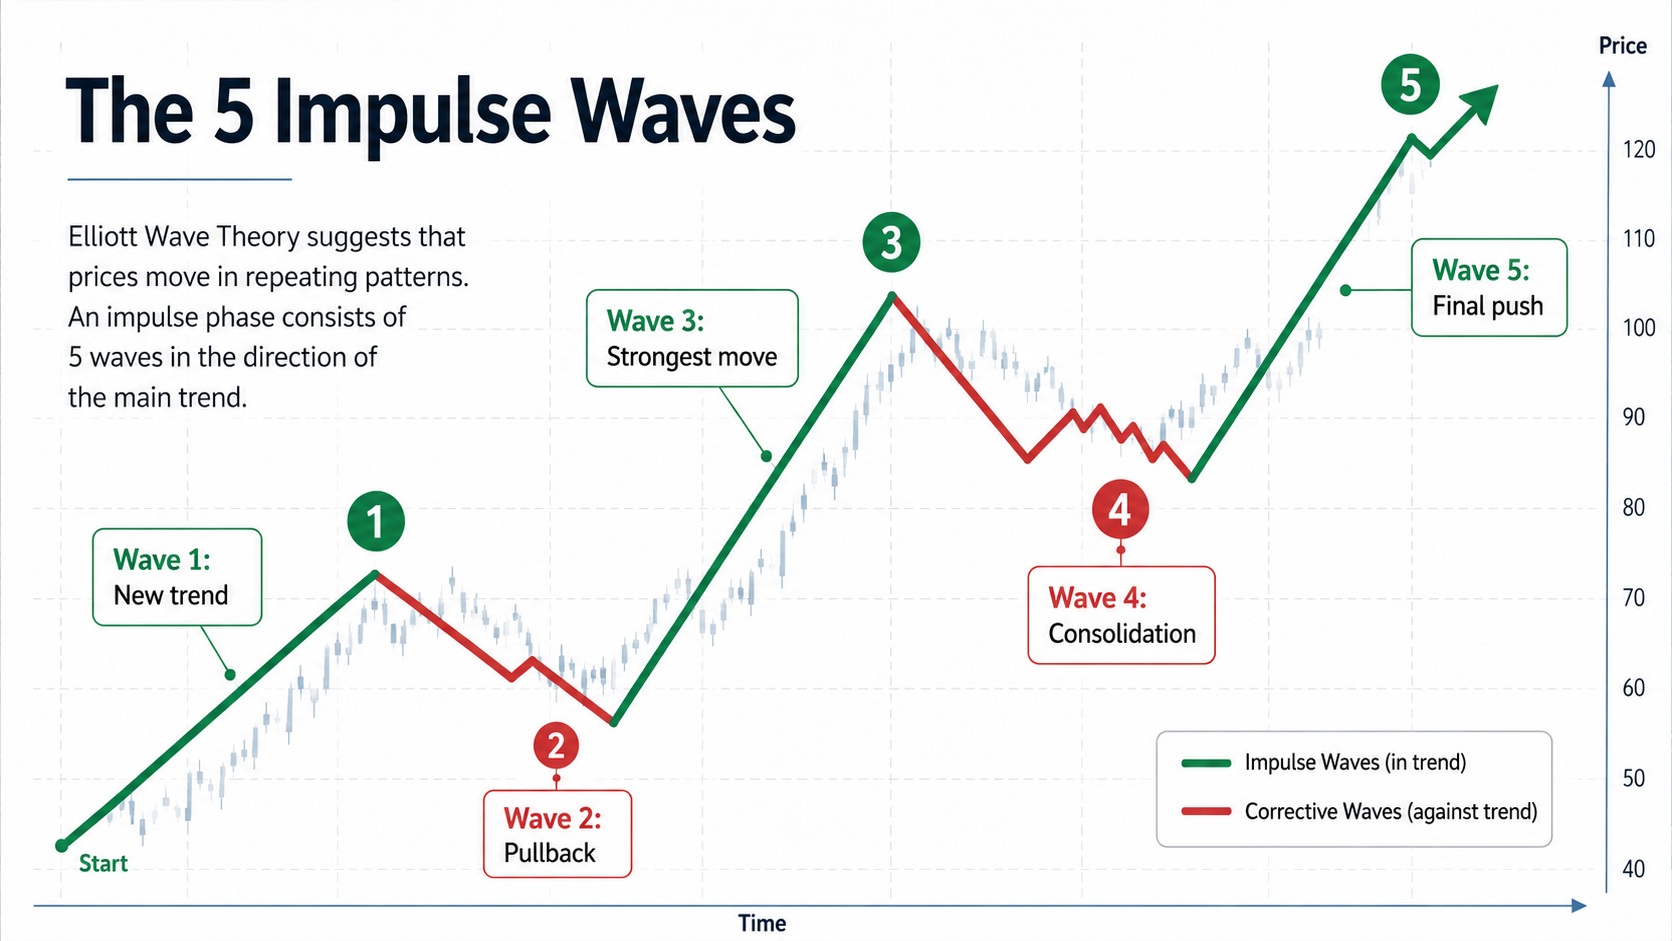
Wave 1: The Beginning of a New Trend
Wave 1 is the first move in a new trend. At this stage, many traders may not believe the trend has changed yet. The move can look small or uncertain.
Wave 2: The First Pullback
Wave 2 is a correction of Wave 1. Some traders think the old trend is coming back, so the price pulls back. However, according to Elliott Wave rules, Wave 2 should not move beyond the starting point of Wave 1.
Wave 3: The Strongest Move
Wave 3 is usually the strongest and most powerful wave. More traders start to recognize the trend, volume may increase, and price can move quickly. Many traders consider Wave 3 the best trading opportunity in the Elliott Wave structure.
Wave 4: The Consolidation Phase
Wave 4 is another pullback or sideways movement. After the strong Wave 3, the market needs time to rest. This wave is usually not as deep as Wave 2.
Wave 5: The Final Push
Wave 5 is the final move in the direction of the trend. At this stage, many traders may feel confident, but the trend can become weaker. After Wave 5, the market often starts a larger correction.
What Is the ABC Correction?
After the 5-wave impulse move, the market usually enters a corrective phase. This correction often has three waves: A, B, and C.
- Wave A: The first move against the main trend
- Wave B: A temporary rebound or pullback
- Wave C: The final move that completes the correction
For example, in an uptrend, the price moves higher in five waves. Then it may fall in Wave A, bounce in Wave B, and fall again in Wave C. After the ABC correction is complete, the market may continue the larger trend or start a new cycle.
The 3 Main Rules of Elliott Wave Theory
Elliott Wave Theory has many guidelines, but there are three important rules that every beginner should know.
| Rule | Simple Explanation |
|---|---|
| Rule 1 | Wave 2 cannot retrace more than 100% of Wave 1. |
| Rule 2 | Wave 3 cannot be the shortest wave among Waves 1, 3, and 5. |
| Rule 3 | Wave 4 should not overlap the price area of Wave 1, except in special patterns such as diagonals. |
These rules help traders avoid incorrect wave counts. If a wave count breaks one of these rules, the count is likely wrong and should be reviewed.
Elliott Wave Theory and Fibonacci
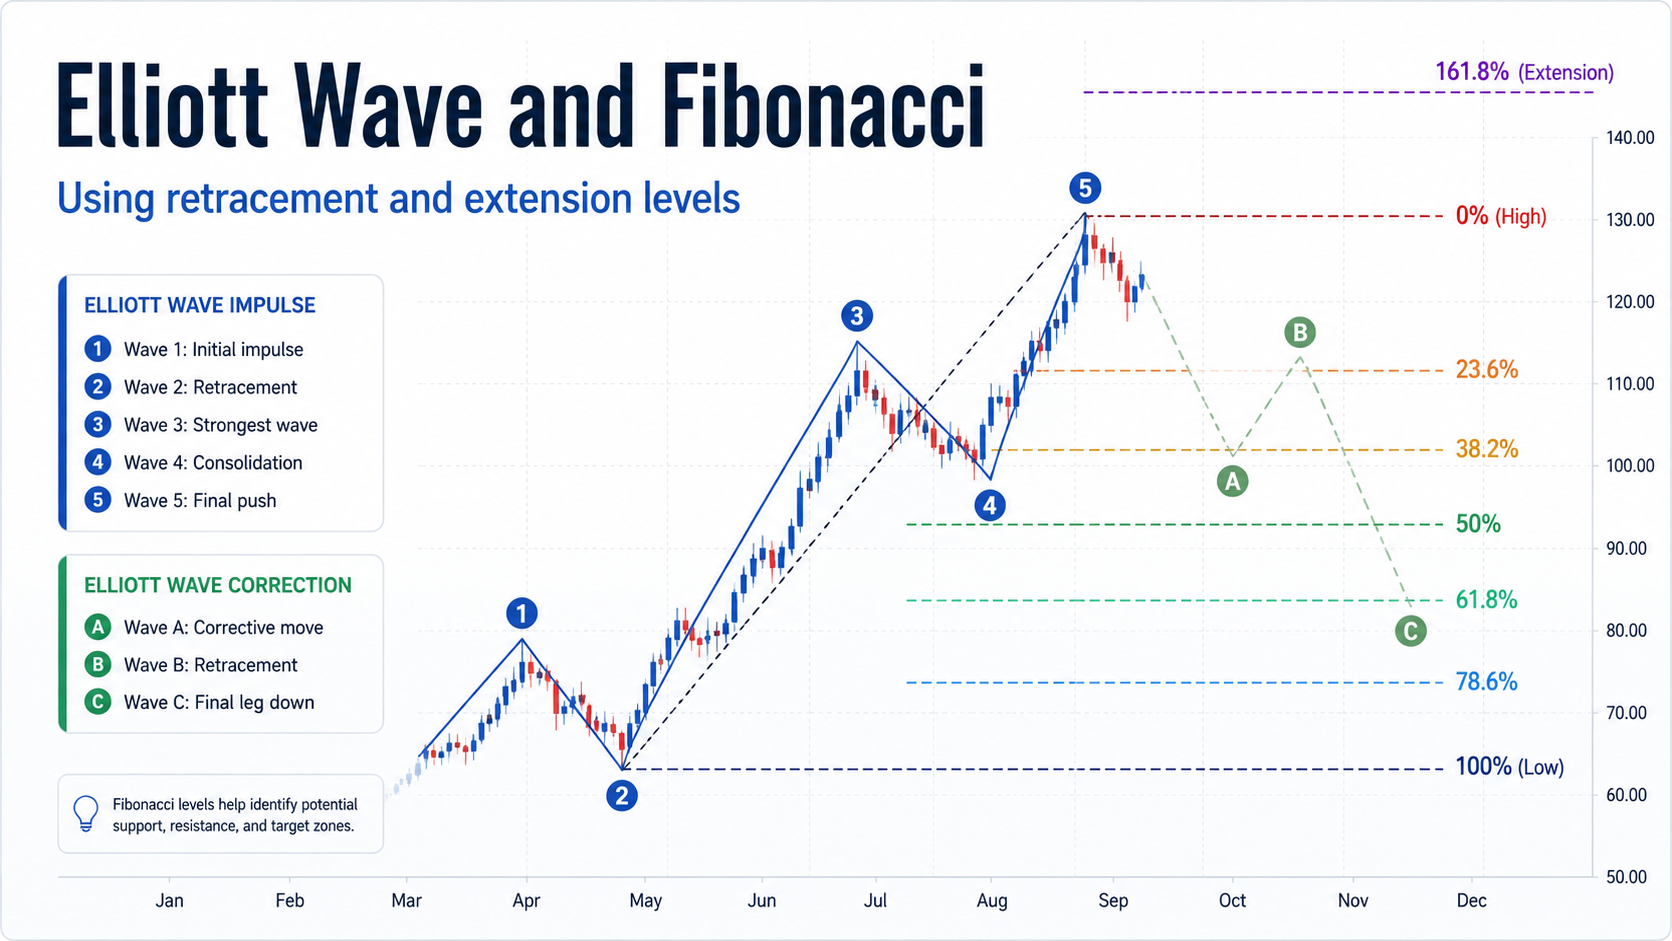
Many traders use Elliott Wave Theory together with Fibonacci levels. Fibonacci retracement and extension tools help traders estimate possible support, resistance, and price targets.
Common Fibonacci relationships include:
- Wave 2 often retraces around 50% or 61.8% of Wave 1.
- Wave 3 is often extended and may reach around 161.8% of Wave 1.
- Wave 4 is usually a smaller correction compared to Wave 2.
- Wave 5 may be similar in length to Wave 1 or related to the full move from Waves 1 to 3.
These levels are not guaranteed. They are only possible areas where the price may react.
Market Psychology Behind Elliott Waves
Elliott Wave Theory is not only about patterns. It is also about market psychology.
| Wave | Market Psychology |
|---|---|
| Wave 1 | Early optimism appears, but many traders are still unsure. |
| Wave 2 | Doubt returns as the market pulls back. |
| Wave 3 | Confidence grows and more traders join the trend. |
| Wave 4 | The market pauses as traders take profit. |
| Wave 5 | Strong confidence or overconfidence appears near the end of the trend. |
| ABC Correction | The market resets as fear, uncertainty, or profit-taking increases. |
This is why Elliott Wave Theory can be useful. It helps traders understand what may be happening behind price movement.
How Traders Use Elliott Wave Theory
Traders use Elliott Wave Theory to understand market structure and plan possible trades. It can help with:
- Identifying the main trend
- Finding possible entry points during pullbacks
- Estimating potential price targets
- Understanding when a trend may be losing strength
- Avoiding late entries near the end of a move
For example, if a trader believes the market is in Wave 2 and the main trend is still up, they may look for a buying opportunity before Wave 3 begins. If the market appears to be in Wave 5, the trader may become more careful because a correction could be coming.
However, wave counting can be subjective. Two traders may look at the same chart and have different wave counts. This is why it is important to combine Elliott Wave Theory with confirmation tools such as trendlines, price action, momentum indicators, and risk management.
A Simple Elliott Wave Example
Let’s use a simple example.
Imagine a stock moves like this:
- Price rises from $100 to $120. This could be Wave 1.
- Price pulls back from $120 to $110. This could be Wave 2.
- Price rallies strongly from $110 to $145. This could be Wave 3.
- Price corrects from $145 to $135. This could be Wave 4.
- Price rises again from $135 to $155. This could be Wave 5.
After this 5-wave move, the stock may correct:
- Price falls from $155 to $140. This could be Wave A.
- Price rebounds from $140 to $148. This could be Wave B.
- Price falls again from $148 to $130. This could be Wave C.
This is a simple 5-wave impulse followed by a 3-wave correction.
Advantages of Elliott Wave Theory
Elliott Wave Theory can be useful because it gives traders a framework to understand price movement. Some advantages include:
- It helps traders see the bigger market structure.
- It can be used on different timeframes.
- It connects price action with market psychology.
- It works well with Fibonacci tools.
- It can help traders avoid emotional decisions.
Limitations of Elliott Wave Theory
Elliott Wave Theory is powerful, but it is not perfect. Traders should understand its limitations before using it.
- Wave counting is subjective: Different traders may label the same chart differently.
- It does not guarantee price movement: The market can always move against your analysis.
- It can be difficult for beginners: Corrective waves can be especially confusing.
- It works better in clear trends: Sideways or choppy markets can create false signals.
- It should not be used alone: Traders should always use confirmation and proper risk management.
The goal is not to predict the market perfectly. The goal is to build a better trading plan and understand possible market scenarios.
Common Mistakes Beginners Make
When learning Elliott Wave Theory, beginners often make some common mistakes:
- Trying to label every small price movement
- Ignoring the higher timeframe
- Forcing a wave count even when the chart is unclear
- Using Elliott Wave Theory without confirmation
- Entering trades too early before the wave structure is clear
- Forgetting to use stop-loss and position sizing
To avoid these mistakes, keep your analysis simple. Start with the basic 5-wave and ABC structure before learning advanced Elliott Wave patterns.
Is Elliott Wave Theory Reliable?
Elliott Wave Theory can be reliable when it is used correctly, but it is not a magic prediction tool. It helps traders understand market structure, but it cannot guarantee future price movement.
The reliability of Elliott Wave Theory depends on several factors, including market condition, timeframe, trader experience, and confirmation from other tools. In trending markets, wave patterns are often easier to identify. In sideways markets, wave counts can become unclear.
For best results, traders should use Elliott Wave Theory as part of a complete trading strategy. This may include trading strategies, technical indicators, support and resistance, and strong risk management.
Final Thoughts
Elliott Wave Theory is a useful way to study market trends, corrections, and trader psychology. The basic idea is simple: markets often move in a 5-wave impulse pattern followed by a 3-wave correction.
For beginners, the most important things to remember are:
- Markets move in waves.
- The main structure is 5 waves up and 3 waves down, or the reverse in a downtrend.
- Wave 3 is often the strongest wave.
- Fibonacci levels can help estimate possible targets.
- Elliott Wave analysis should be combined with other tools.
With practice, Elliott Wave Theory can help traders read charts more clearly and make better trading decisions. However, it should always be used with discipline, confirmation, and proper risk management.
Disclaimer: This article is for educational purposes only and should not be considered financial advice. Trading involves risk, and you should always do your own research before making any trading decision.
Frequently Asked Questions
What is Elliott Wave Theory in simple terms?
Elliott Wave Theory is a method of technical analysis that suggests markets move in repeating wave patterns caused by investor psychology.
What are the 5 waves in Elliott Wave Theory?
The 5 waves are the impulse waves that move in the direction of the main trend. Waves 1, 3, and 5 move with the trend, while Waves 2 and 4 are pullbacks.
What is an ABC correction?
An ABC correction is a 3-wave move that usually happens after a 5-wave impulse move. It shows the market correcting before the next possible trend move.
Is Elliott Wave Theory good for beginners?
Yes, beginners can learn Elliott Wave Theory, but they should start with the basic 5-wave and ABC pattern before studying advanced wave structures.
Can Elliott Wave Theory predict the market?
No method can predict the market with 100% accuracy. Elliott Wave Theory helps traders understand possible market structure, but it should be used with other tools and proper risk management.

